Moving averages are a statistical tool used to analyse stock charts in the investment market. Their main purpose is to smooth out short-term fluctuations and highlight long-term trends or patterns in the data. We seek to answer the questions: what exactly they are, how often they intersect with the chart on the S&P 500 (US500), Nasdaq 100 (US100) and Dax 40 (DE40) indices, what we could expect from them, and how they could help us make investment decisions according to the mean reversion theory.
Table of contents:
- What is a simple moving average SMA?
- How often do the moving averages intersect on a chart of the SPX, Nasdaq 100 and DAX 40 indices?
- How do we use moving averages in our trading? The mean reversion theory
What is a simple moving average SMA?
The Simple Moving Average (SMA) is one of the basic technical analysis methods used in financial markets, including stock indices. The SMA calculates the average value of the prices of a given financial instrument over a specific period of time, expressing it as a line on a chart (see below). It is a tool for smoothing short-term price fluctuations and highlighting long-term trends.
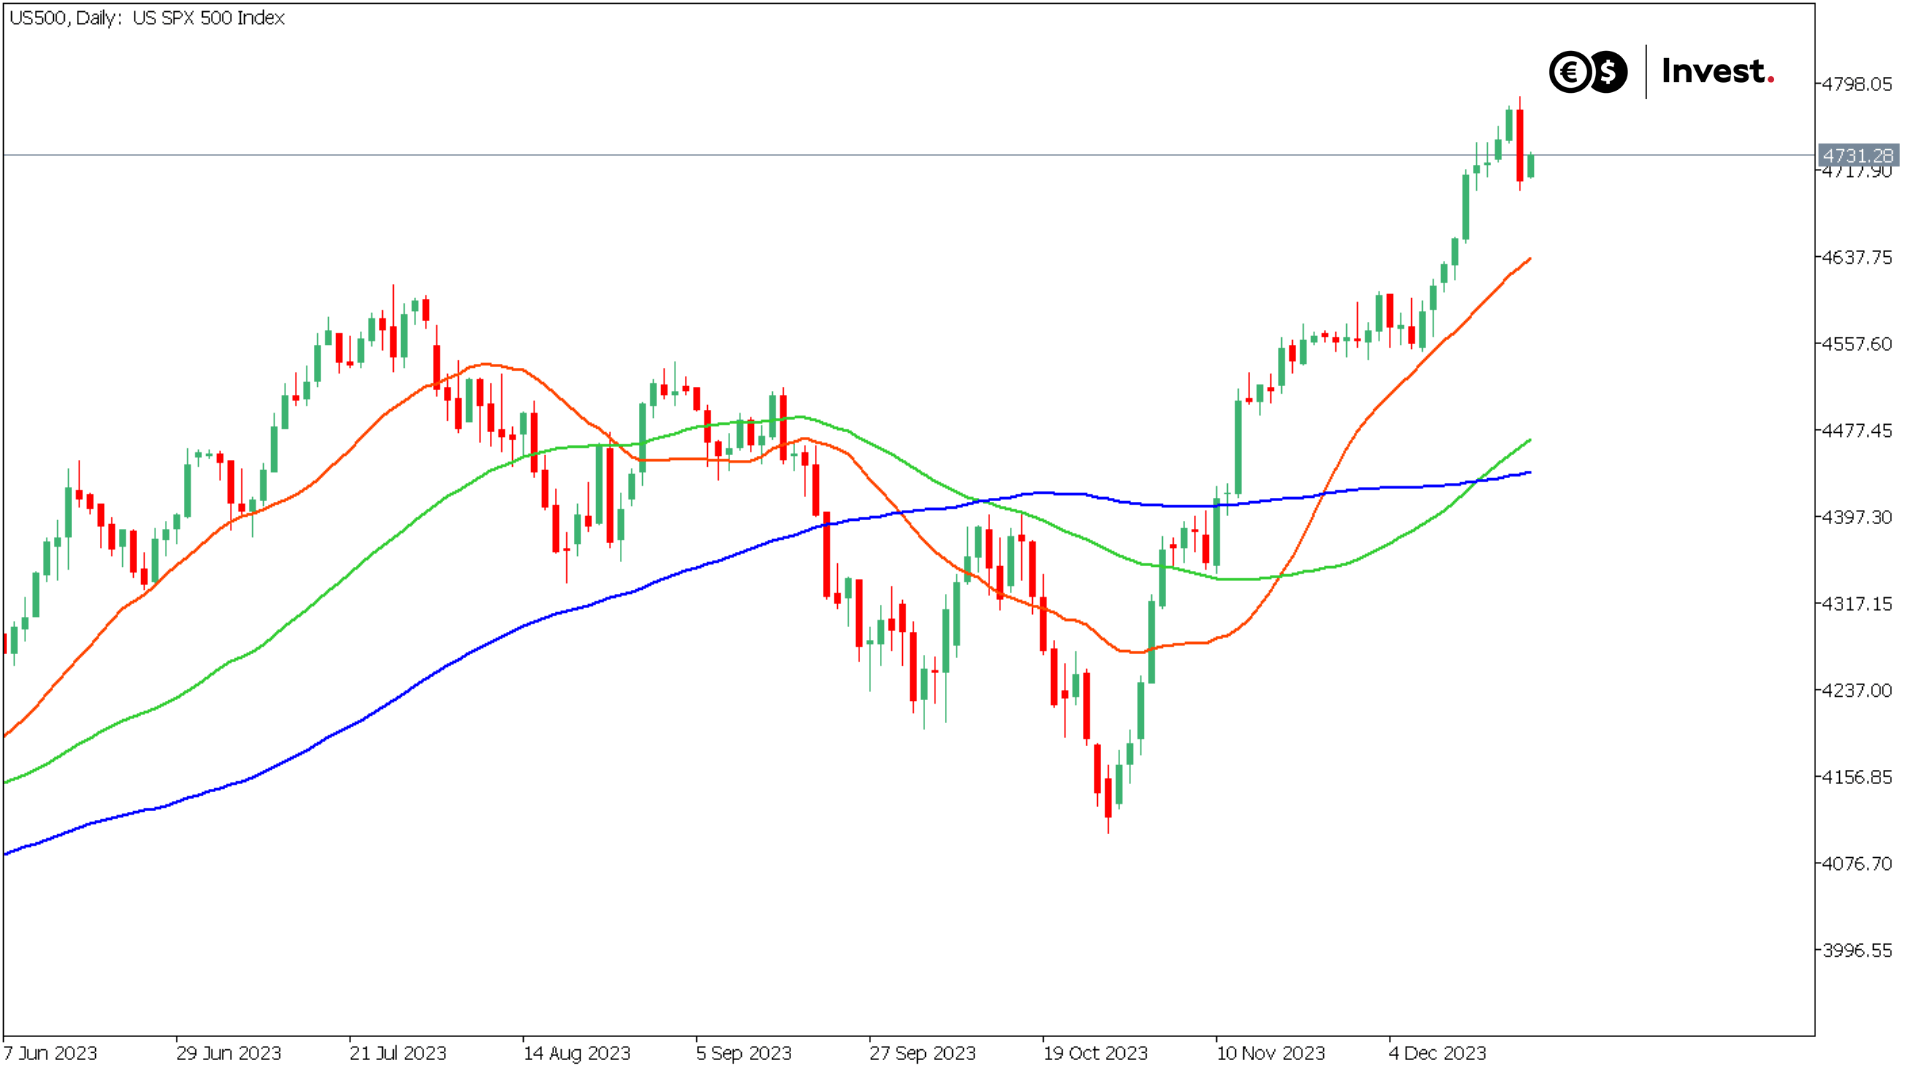
Source: Conotoxia MT5, US500, Daily
We will look at three types of moving averages, known as SMA20 (red), SMA50 (green) and SMA100 (blue) on a daily timeframe.
The SMA is commonly used to identify trends and support and resistance levels. In technical analysis, traders often compare different SMA periods (for example, the 20-day and 100-day) to get different perspectives on short- and long-term price trends. However, it is worth bearing in mind that the SMA has its limitations and does not always provide complete information about market dynamics, which we will try to approximate.
How often do the moving averages intersect on a chart of the SPX, Nasdaq 100 and DAX 40 indices?
Analysing the price data of the major indices since 1971, we note that in the case of the S&P 500 index, it has remained above the SMA20 moving average for 61.4% of the time, above the SMA50 for 65.1% of the time and above the SMA100 for 69.8% of the time. Thus, for most of the time, irrespective of the moving average adopted, we have seen a short-term, medium-term and long-term uptrend.
In the case of the US technology index Nasdaq 100 for the moving average:
- SMA20 for 61.4% of the time we observed an uptrend;
- SMA50 for 65.1% of the time we observed an uptrend;
- SMA100 for 69.8% of the time we observed an uptrend.
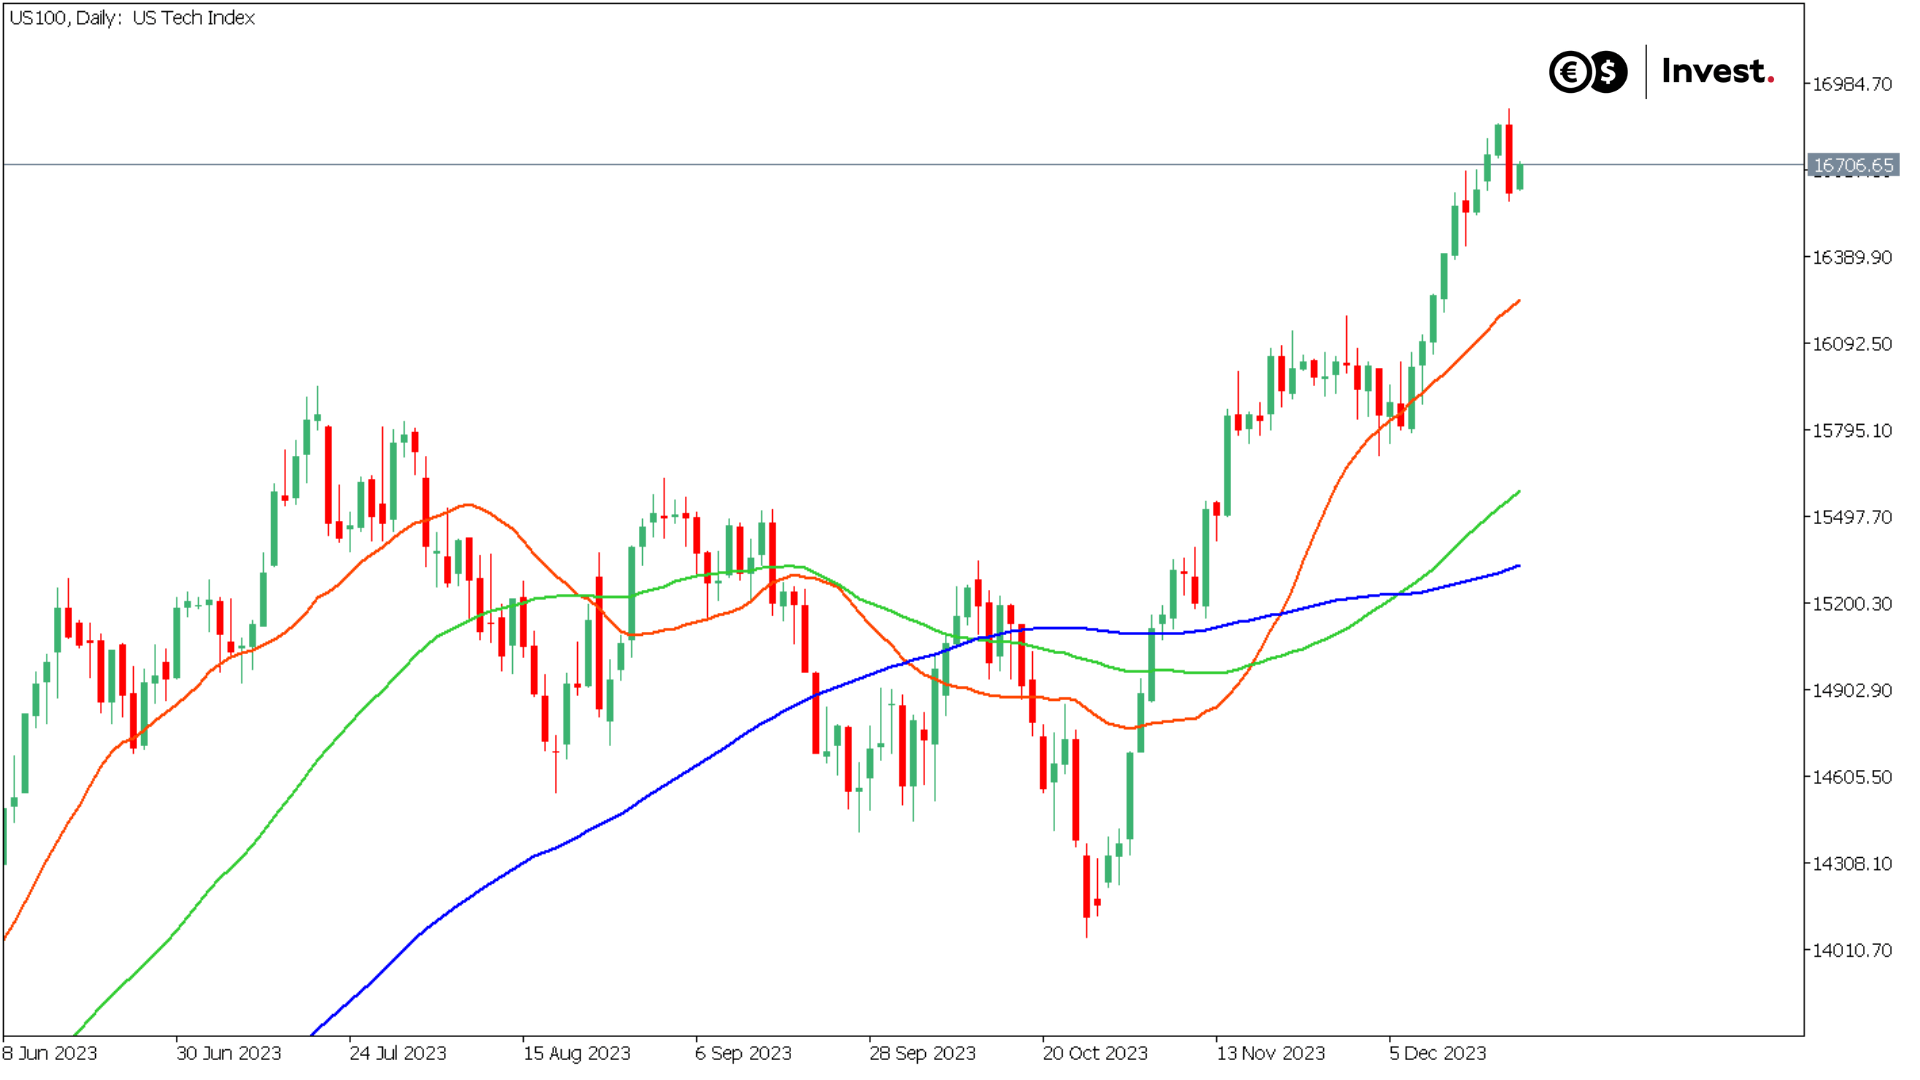
Source: Conotoxia MT5, US100, Daily
In the case of the German DAX 40 index for the moving average:
- SMA20 for 79.2% of the time we observed an upward trend;
- SMA50 for 82.8% of the time we observed an upward trend;
- SMA100 for 84.5% of the time we observed an upward trend.
This would mean that the DAX 40 index had the greatest tendency to remain in an upward trend. It could also be interpreted that this index had the greatest tendency to bounce off the moving averages, suggesting that the latter may be relatively important in the technical analysis of this index, and that their intersection may lead to the greatest relative declines.
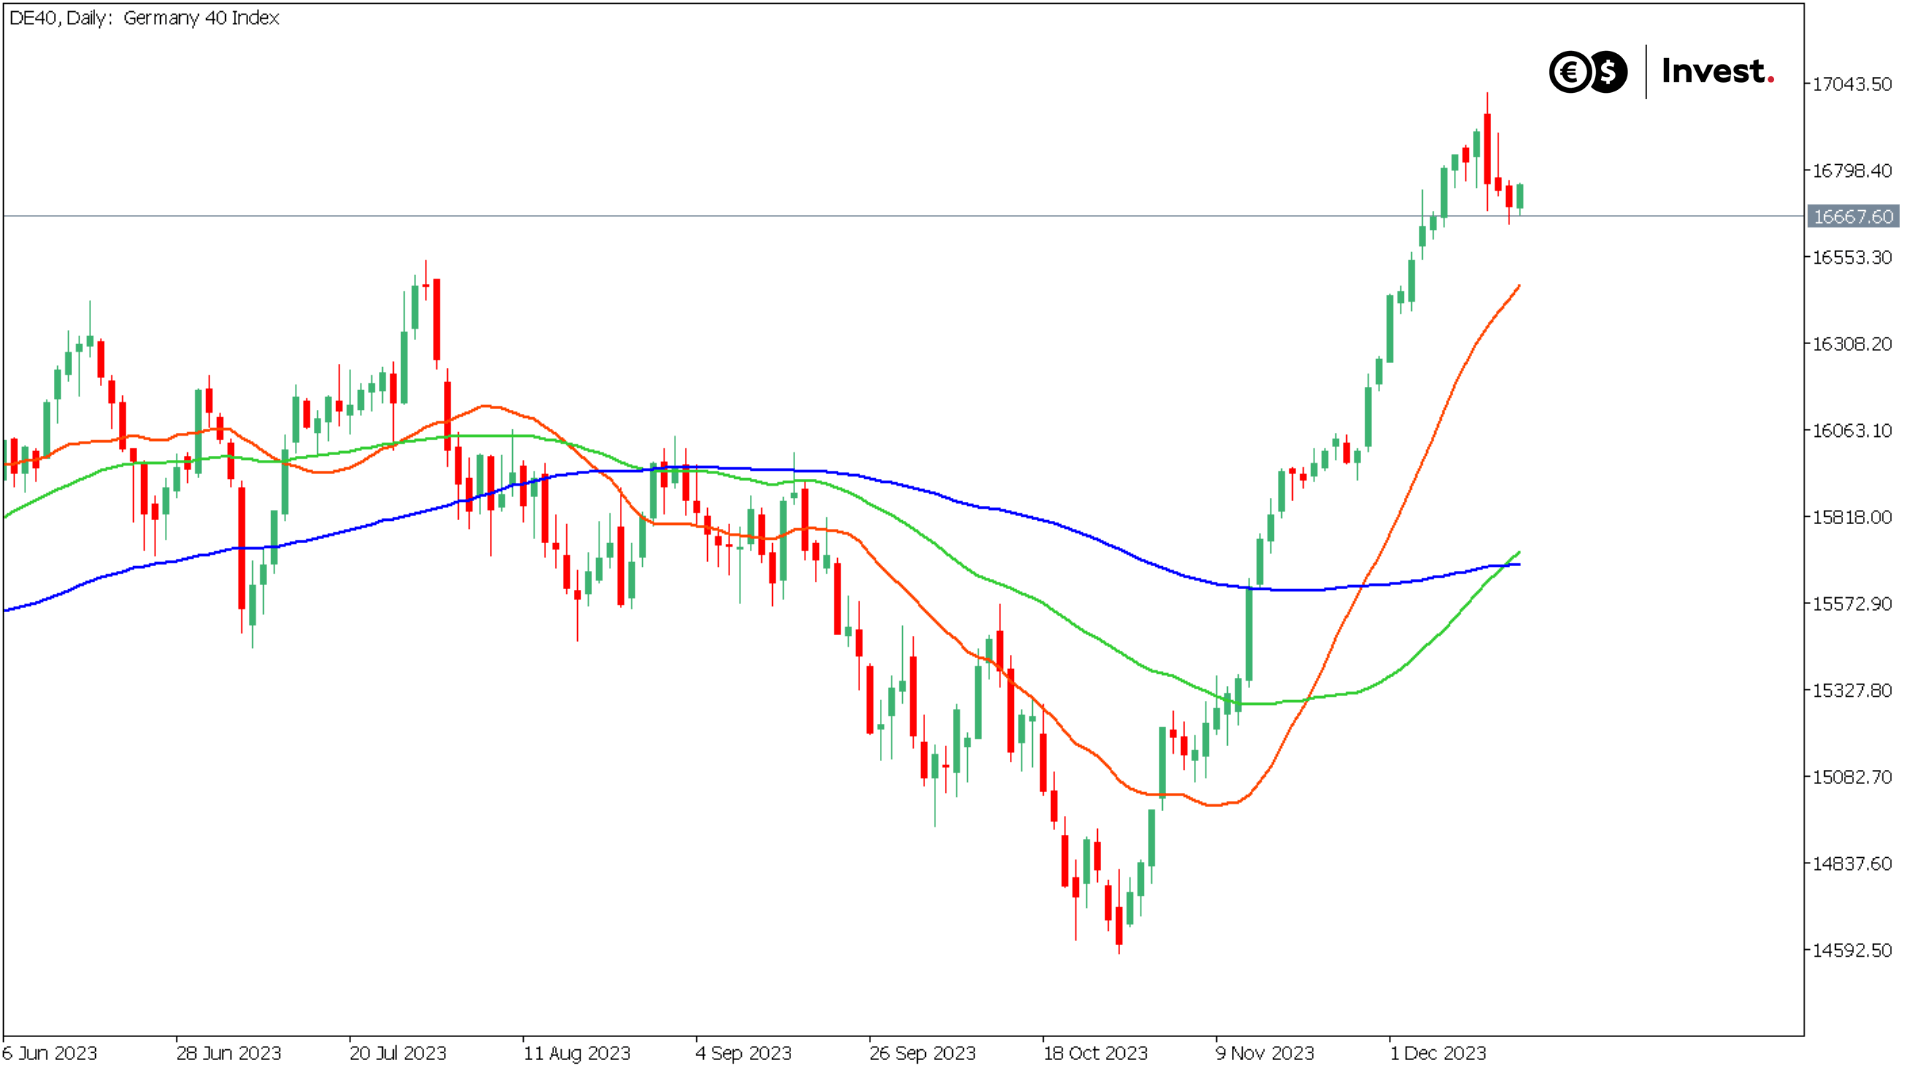
Source: Conotoxia MT5, DE40, Daily
The short-term moving average SMA20 tended to intersect at the close of the session on average every nine trading sessions for all three indices.
The medium-term moving average SMA50 intersected on average every 45 days for the S&P 500 index, 50 days for the Nasdaq 100 and 47 days for the DAX 40.
The long-term moving average SMA100 crossed at the close of the session on average every 105 days for the S&P 500 index, the longest for the Nasdaq 100 every 119 days and the most frequent for the DAX 40 every 92 days.
Hence, the closing of a given session below or above the average and long-term moving averages appears to be an important indicator for possible changes in stock market trends.
How do we use moving averages in our trading? The mean reversion theory
The Mean Reversion Theory is a financial concept that describes the tendency of prices or indices to move towards their historical average value over time. According to this theory, if the price of a financial instrument deviates significantly from its average, there is a tendency for it to move back towards that average.
This theory is based on the assumption that financial markets and asset prices fluctuate periodically, but over the long term tend to return to some fixed equilibrium point, which could be referred to as the average. This phenomenon applies to various financial assets, such as shares, indices or currencies.
This mechanism could be the result of various factors, such as market reactions to news, changes in investor sentiment or simply random market fluctuations. Traders using the theory of reversion to the mean try to identify moments when the price is significantly above or below the historical average, assuming that a return to this point is imminent. How could we use it in trading?
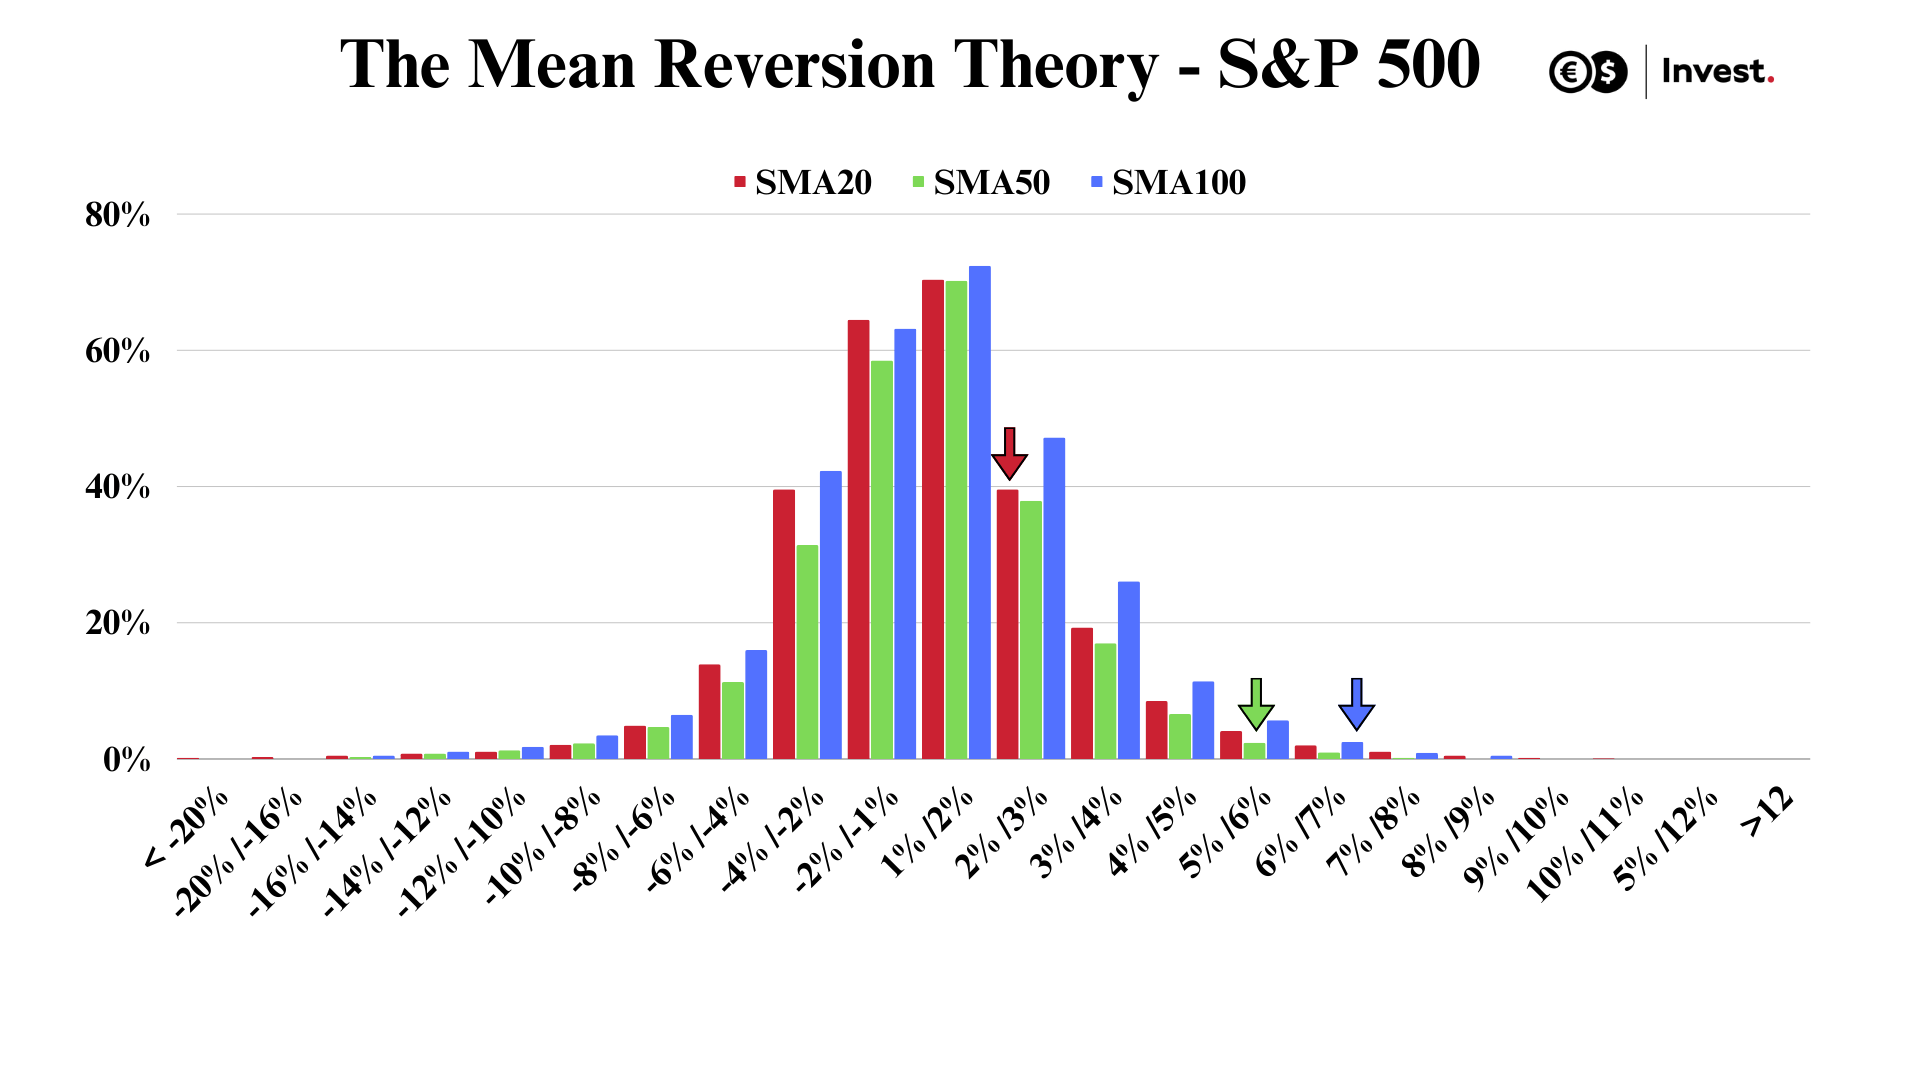
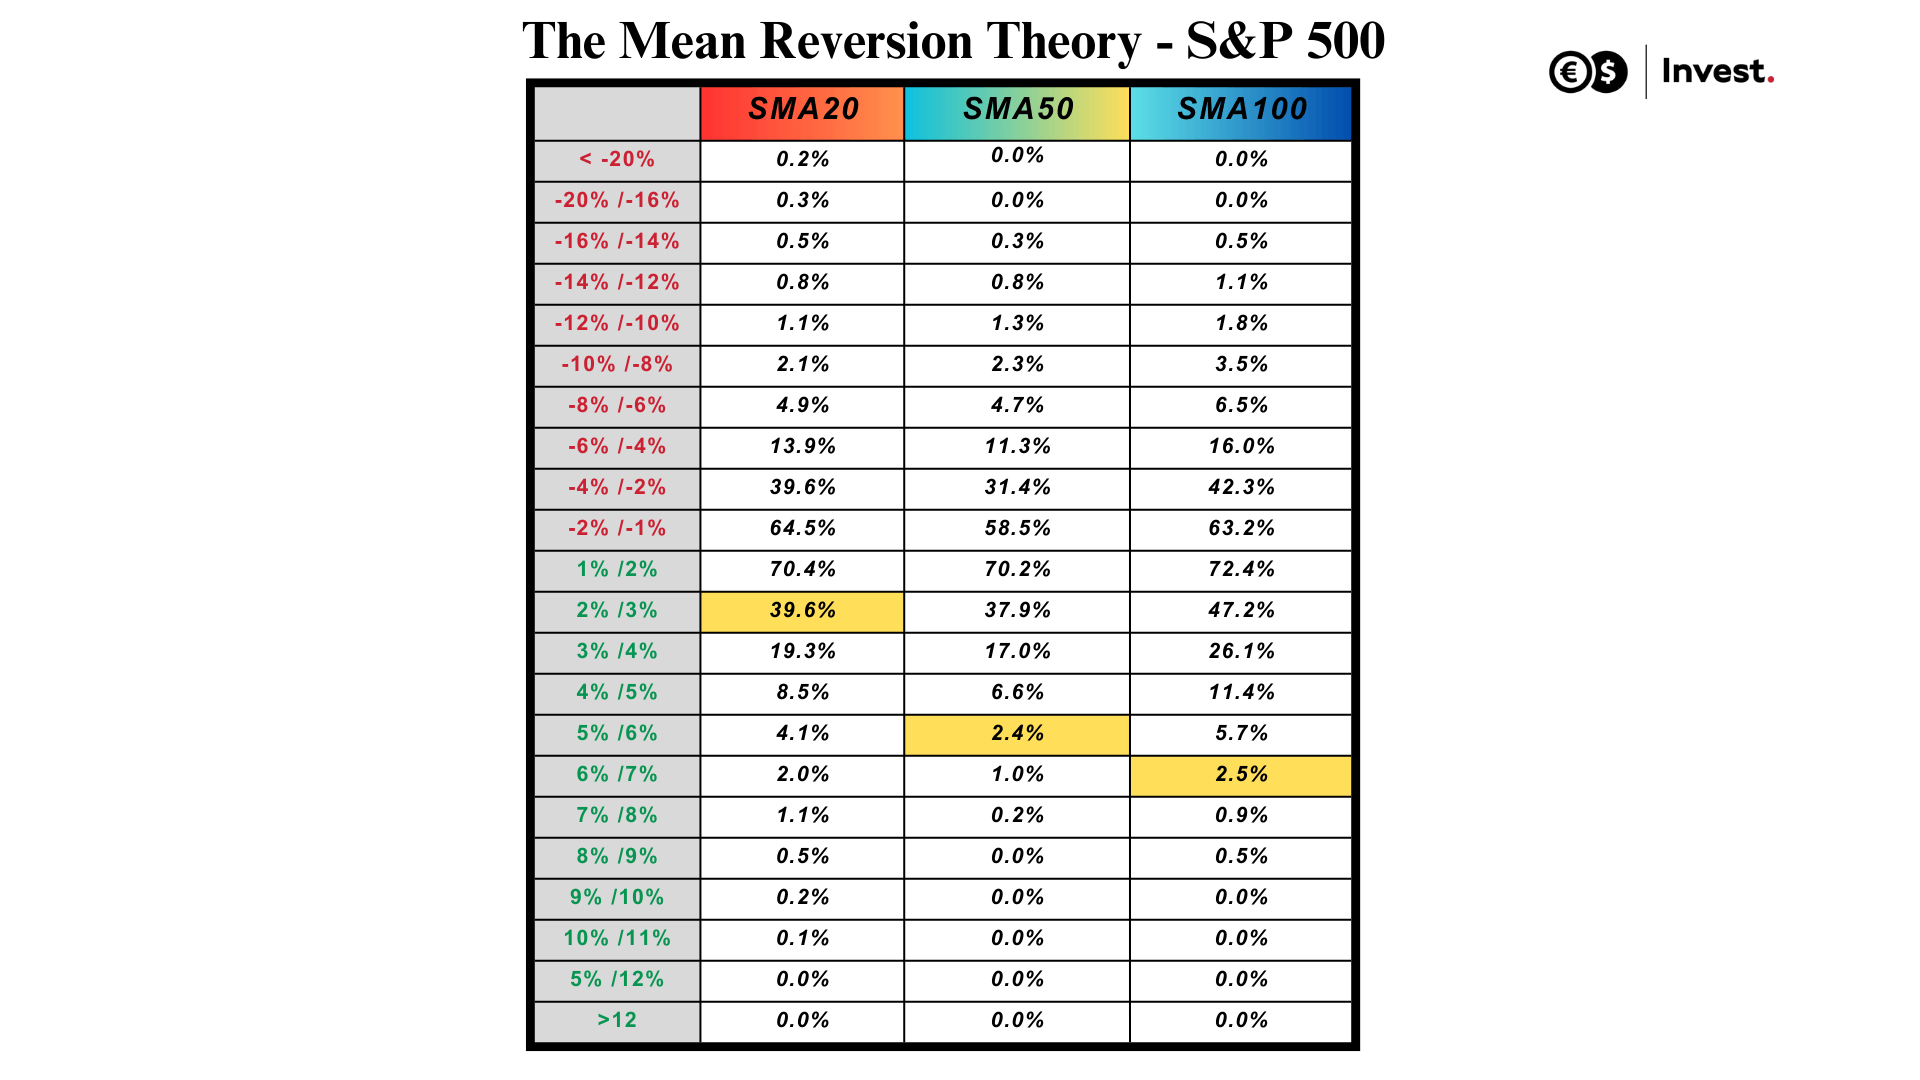
To do so, we will use the distribution of the deviation from the mean to identify the historical probability of a given return to the mean. In the case of the S&P 500 index, this is illustrated as follows:
Source: Conotoxia's own analysis
Source: Conotoxia's own analysis
How to read this data? Let's look at an example of current deviations from the SMA moving averages for the S&P 500 index, which is currently trading 2.1% above the SMA 20 moving average, 5.9% above the SMA 50 and 6.6% above the SMA 100. This means that historically the index has been off by similar or greater amounts in 39.6% of cases for the SMA 20, in just 2.4% of cases for the SMA 50 and 2.5% of cases for the SMA 100.
Such data suggests that there is a historical probability of reversal of 60.4% for the SMA 20, as high as 97.6% for the SMA 50 and 97.5% for the SMA 100, respectively. This, in turn, implies that there is a fairly high chance of a return to the mean in the near future, given the past behaviour of the index.
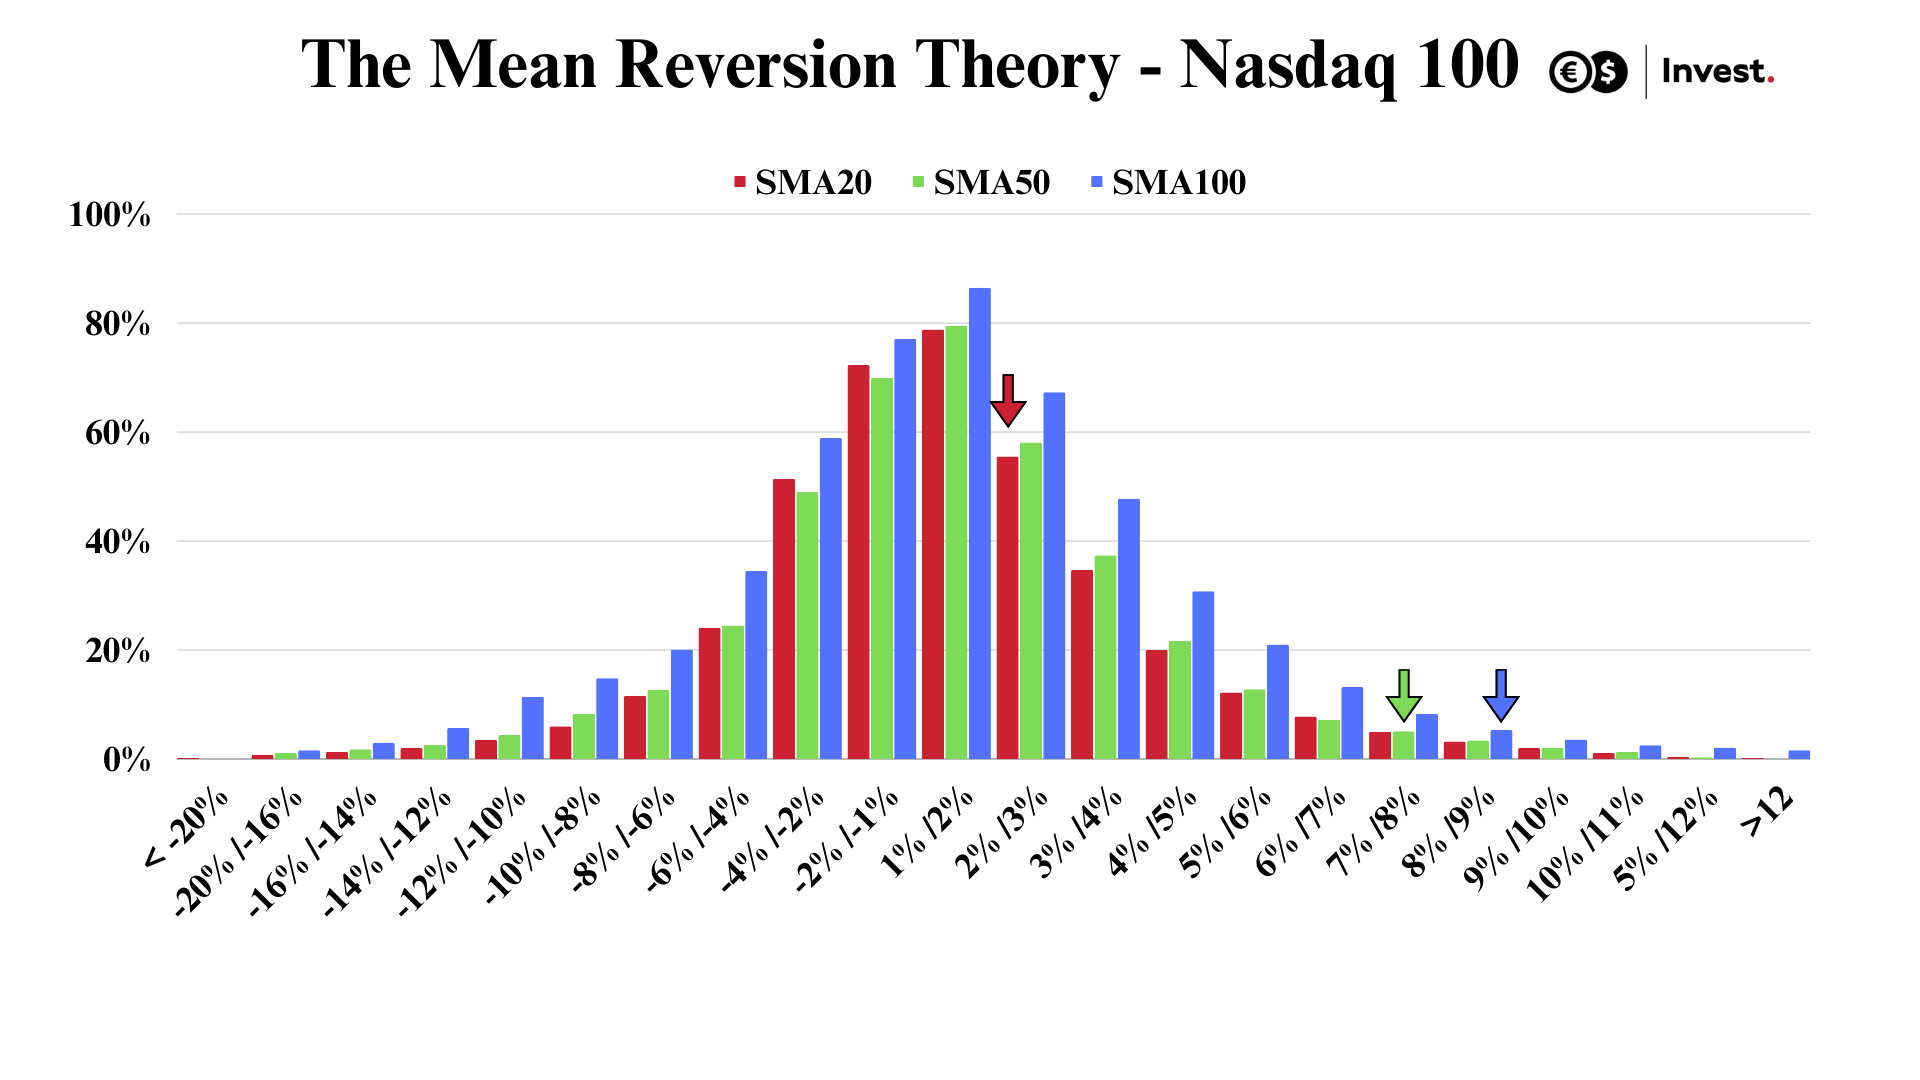
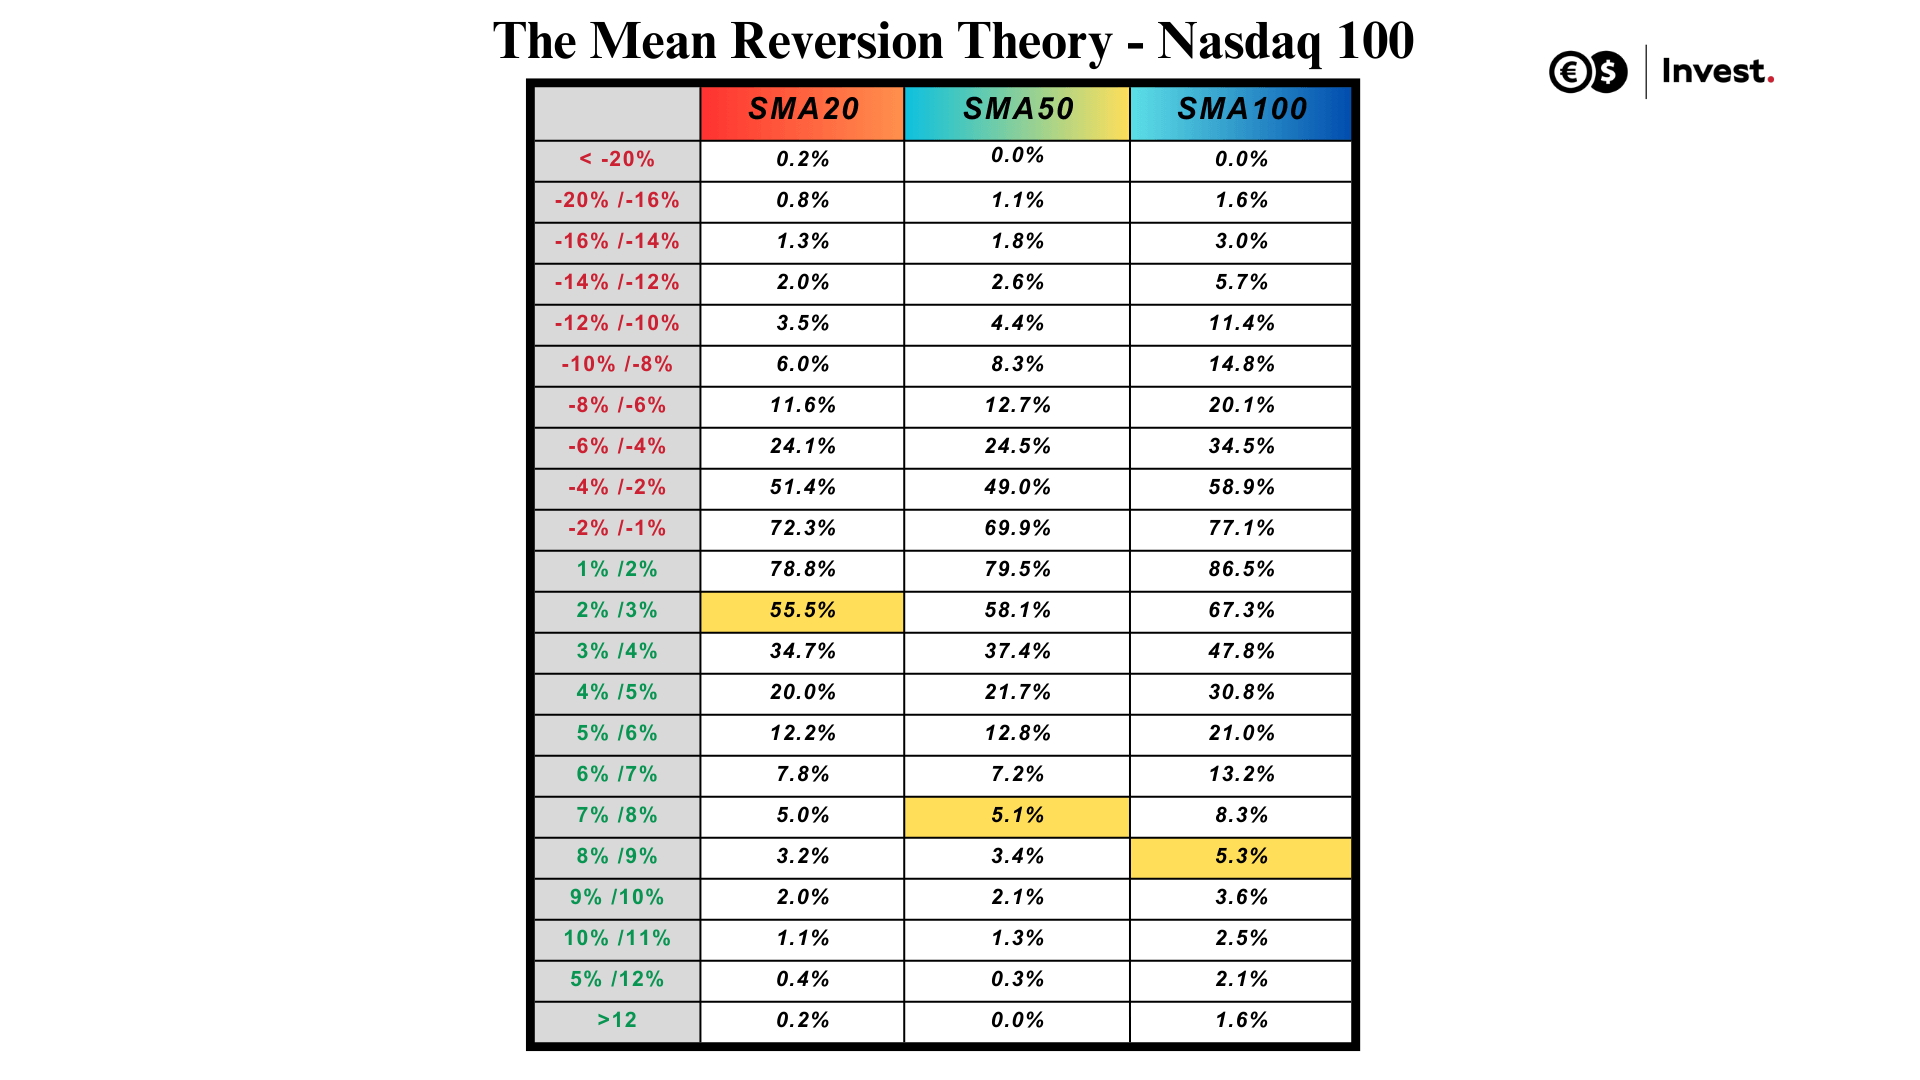
For the Nadaq 100 technology index, the distribution of deviations from the moving average is illustrated as follows:
Source: Conotoxia's own analysis
Source: Conotoxia's own analysis
The Nasdaq 100 is deviating by 2.8% from the SMA20 moving average. Such a deviation or higher occurred 55.5% of the time (probability of returning to the SMA20 44.5%). 7.3% from the SMA50 (probability of returning to the SMA50, as high as 94.9%) and by 8.9% from the SMA100 (probability of returning to the SMA100 94.7%).
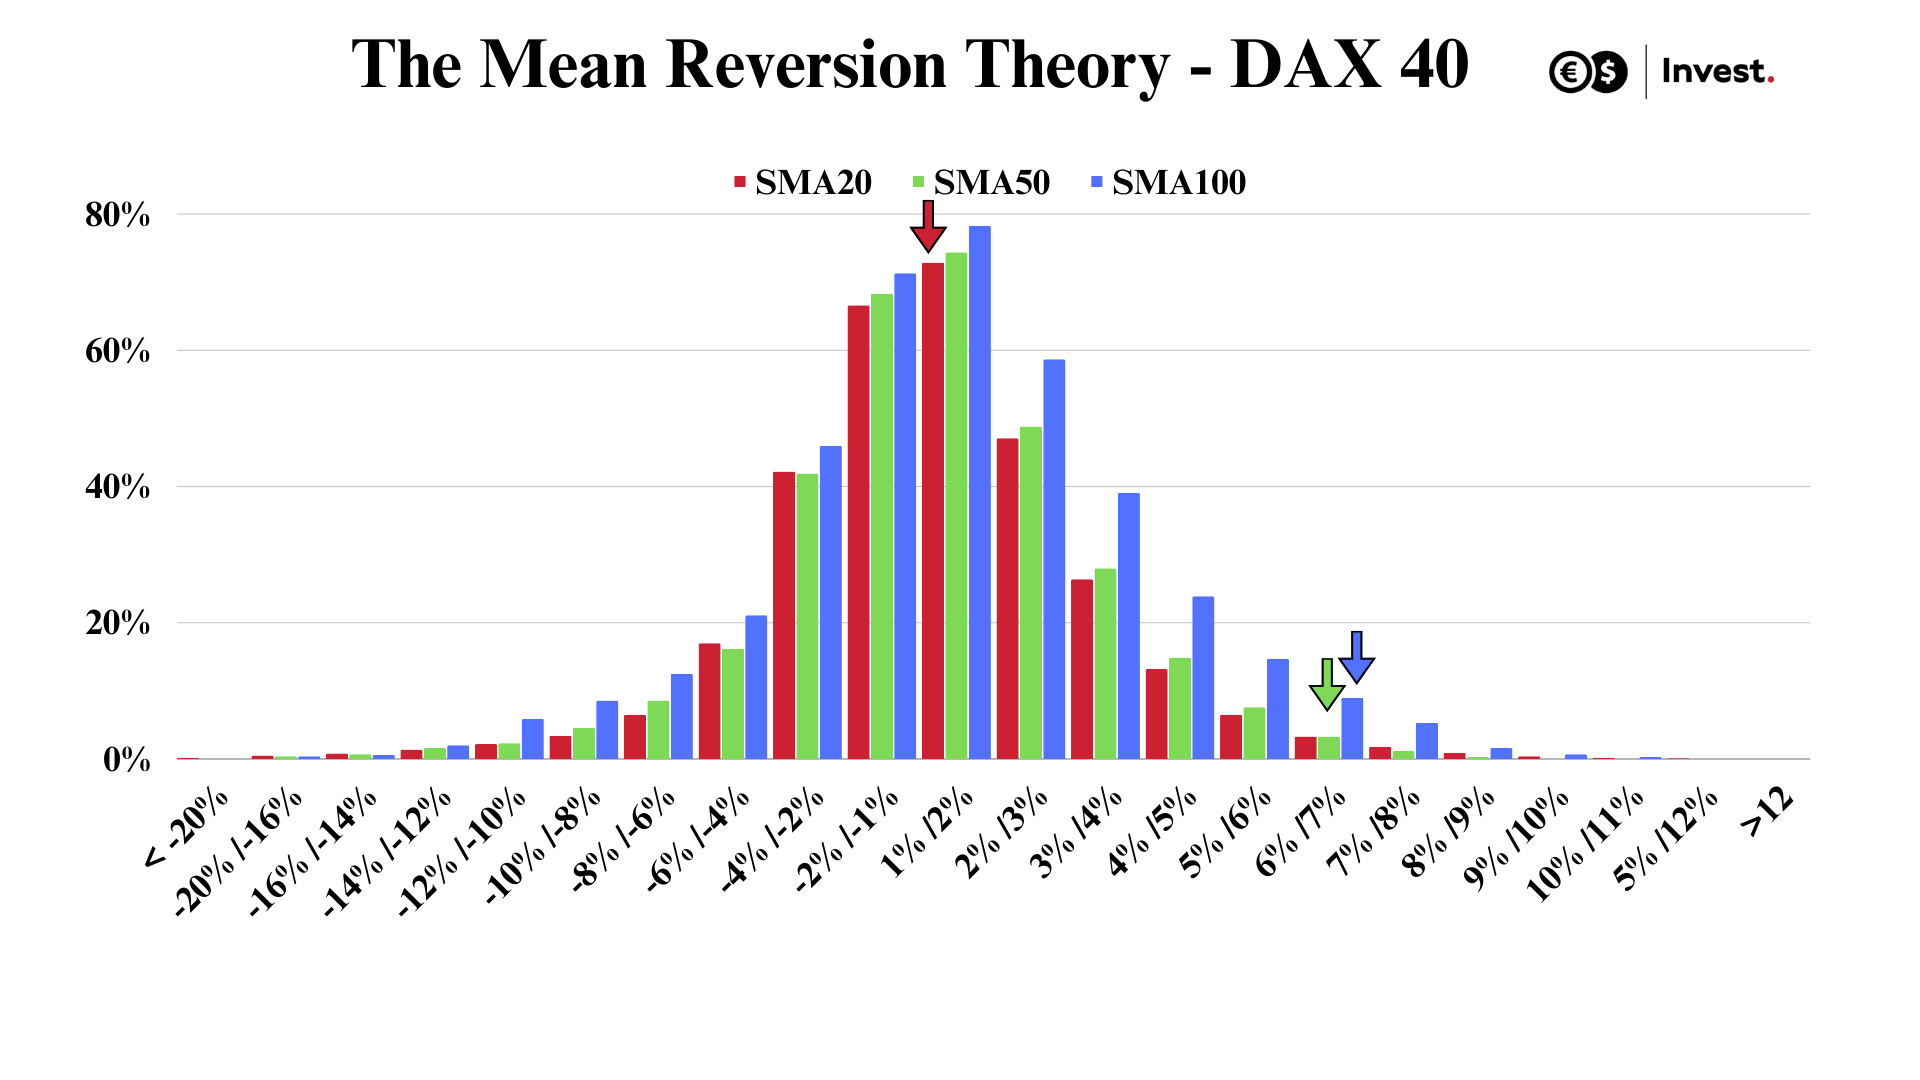
For the German DAX40 index, the distribution is as follows:
Source: Conotoxia's own analysis
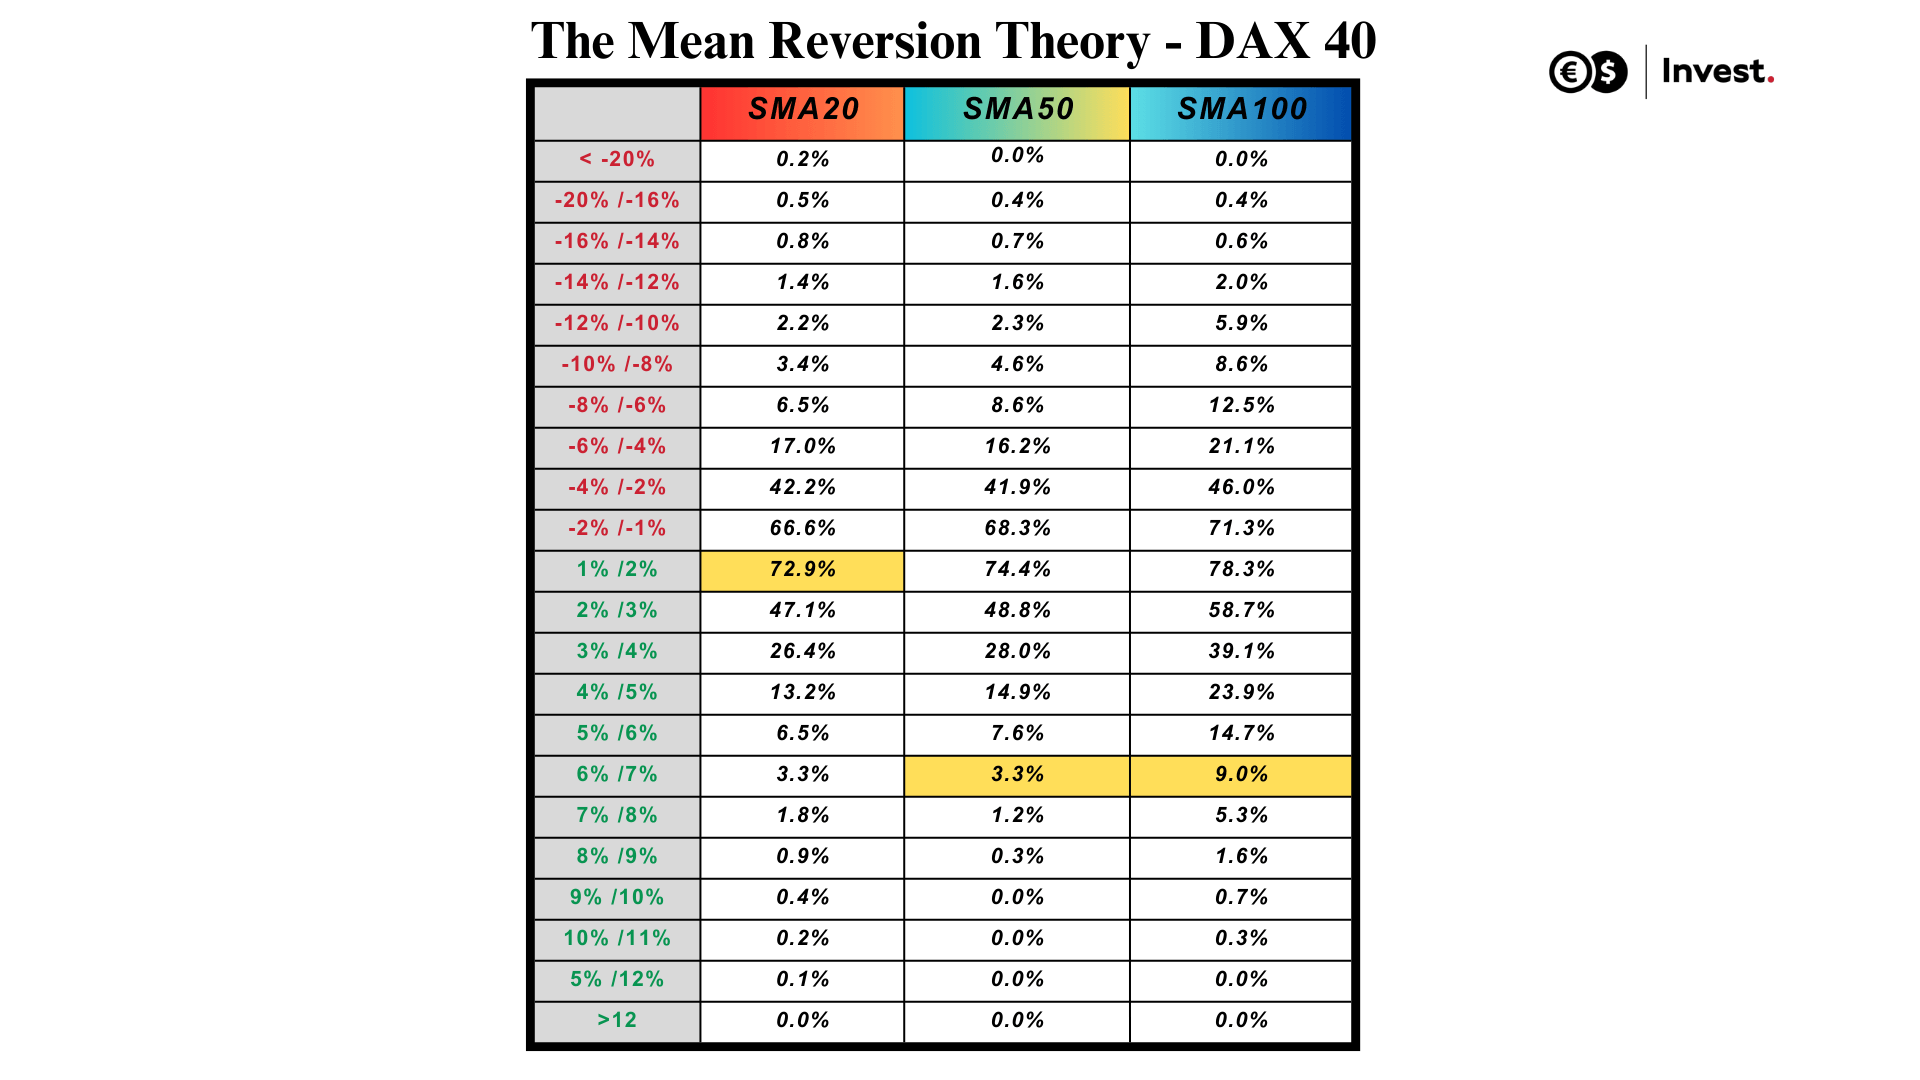
Source: Conotoxia's own analysis
However, it is important to remember that the moving average is constantly changing, so a strategy based solely on catching deviations from it may not have the desired effect. Changing the average over time may affect the effectiveness of such a strategy. Therefore, this tool should be considered as an adjunct to our investment strategy, helping us to better determine the right time to enter the market, which in turn may increase the probability of success. However, it should not be used as a stand-alone indicator in trading.
Grzegorz Dróżdż, CAI MPW, Market Analyst of Conotoxia Ltd. (Conotoxia investment service)
Materials, analysis and opinions contained, referenced or provided herein are intended solely for informational and educational purposes. Personal opinion of the author does not represent and should not be constructed as a statement or an investment advice made by Conotoxia Ltd. All indiscriminate reliance on illustrative or informational materials may lead to losses. Past performance is not a reliable indicator of future results.
CFDs are complex instruments and come with a high risk of losing money rapidly due to leverage. 71.98% of retail investor accounts lose money when trading CFDs with this provider. You should consider whether you understand how CFDs work and whether you can afford to take the high risk of losing your money.
Trade this news from Conotoxia Ltd. platforms
Go to your account