Price gaps on charts are areas where there is a lack of price data for a financial instrument within a specific time period. A price gap occurs when the opening price of a given period differs from the closing price of the previous period, creating an empty space on the chart. Price gaps are often analyzed by traders and technical analysts because it is believed that they can provide significant information about market strength, potential price movement directions, and levels of support and resistance. However, one issue regularly arises in investor analyses, namely the "closing" of price gaps, which is nothing more than a return to the price of the last closing. Let's examine how strong this phenomenon is and how it couldn be used in trading strategies.
Table of contents:
- How often do price gaps occur on the SPX, Nasdaq 100, and DAX indices?
- How often do price gaps "close" on the indices?
- How could we utilize price gaps in our trading?
How often do price gaps occur on the SPX, Nasdaq 100, and DAX indices?
To examine the phenomenon of price gaps on three key indices, namely S&P 500 (US500), Nasdaq 100 (US100), and DAX 40 (DE40), we have decided not to focus on every type of price gap, for example, one that is 0.01%. Instead, we will look at three cases that could significantly impact our investment when it is at least plus-minus 0.1, 0.3, and 0.5%.
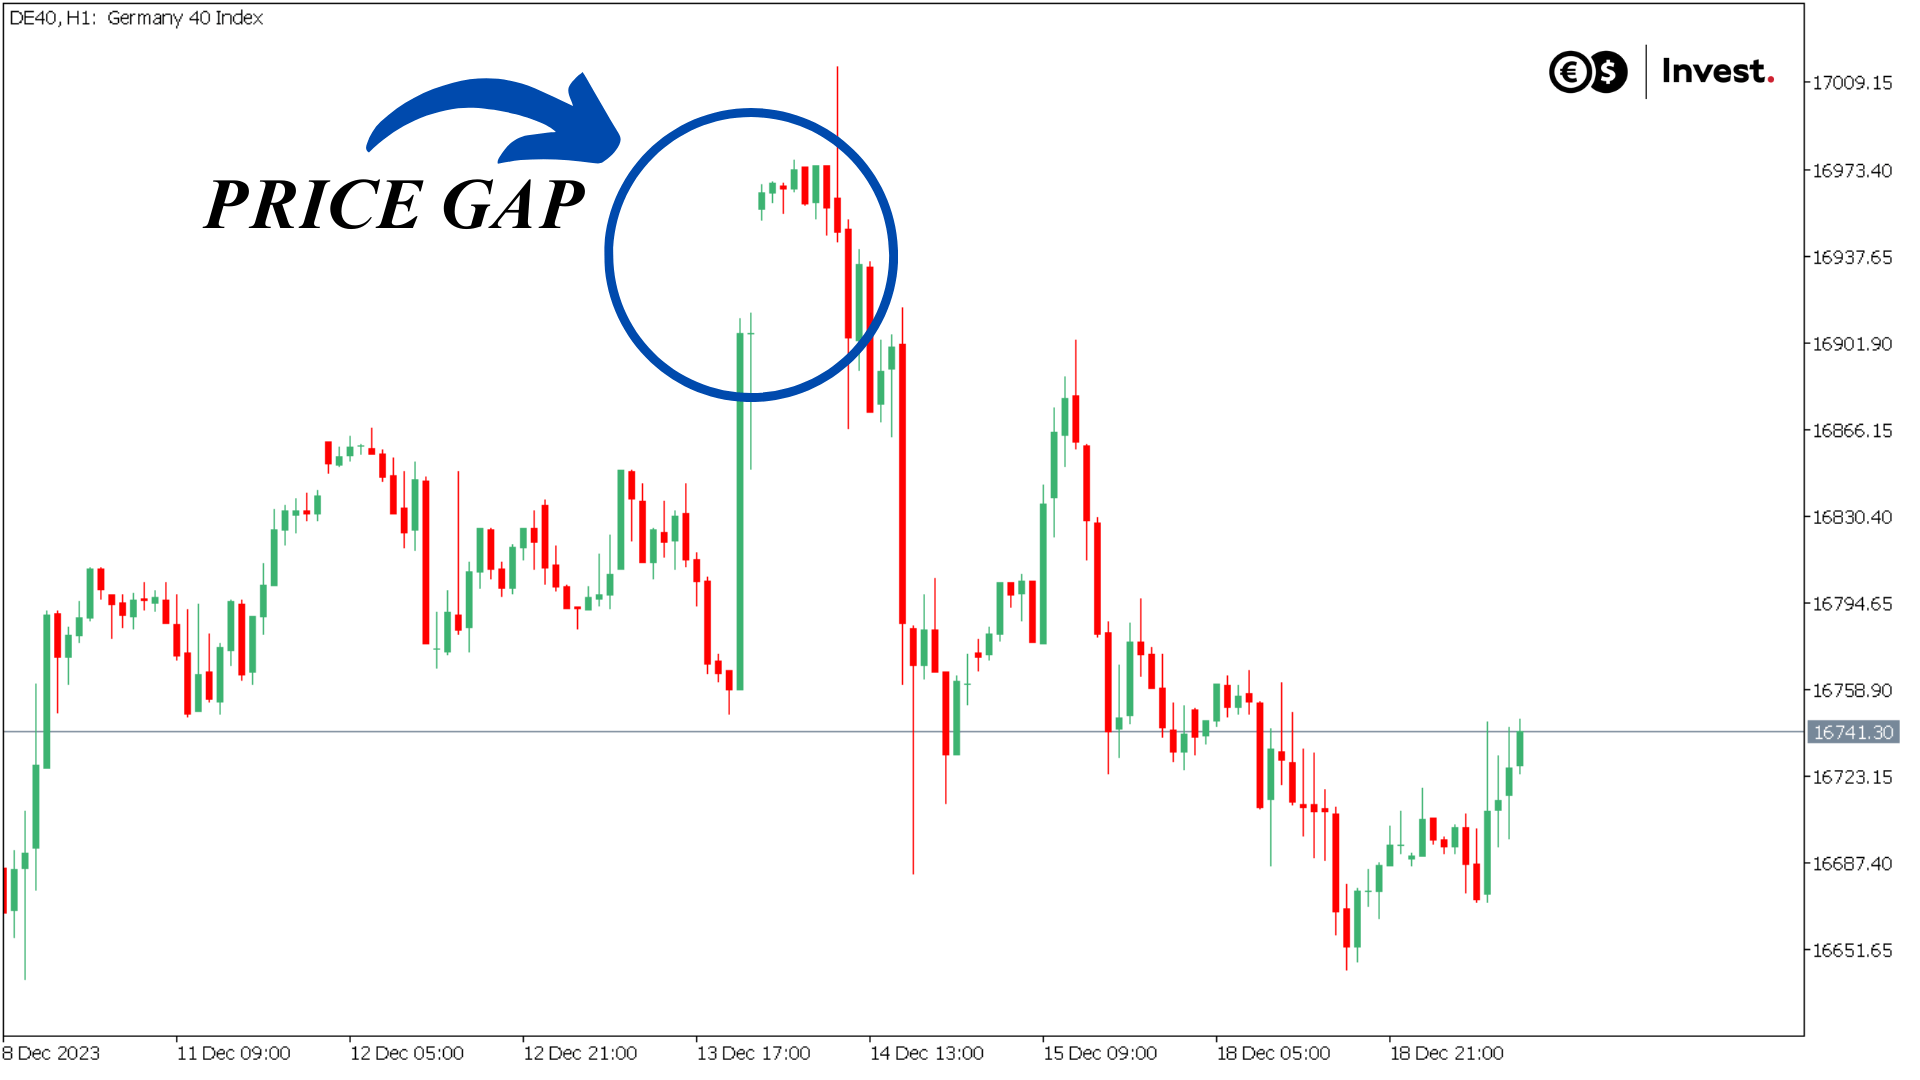
Source: Conotoxia MT5, DE40, H1
To achieve this, we will use data from 1971 for each of the indices. The frequency of price gap occurrences largely depends on the stability of the given financial instrument. Therefore, the most stable among the three main indices is also the largest, namely the S&P 500. A price gap of a minimum size of 0.1% (in both directions) occurred in 18.4% of sessions. For a gap of 0.3%, this frequency dropped to 7.7%, and for a gap of 0.5%, it was only 3.6% of openings.
In the case of the technology-focused Nasdaq 100 index, a price gap of a minimum size of 0.1% occurred much more frequently, practically in almost every other session (53.3% of openings). For a gap of at least 0.3%, it occurs in every third session (36.2% of openings), and a gap of 0.5% appears in every fourth session (24.5% of openings).
However, the most frequent price gaps were observed in the case of the German DAX 40 index. In its case, a price gap of a minimum size of 0.1% occurred in 4 out of 5 sessions (82.7% of openings). A gap of 0.3% occurs in every other session (57.3% of openings), and a gap of 0.5% appears in every third session (38.6% of openings).
How often do price gaps "close" on the indices?
"Closing" price gaps refer to nothing more than a return to the previous closing price, as illustrated in the example below.
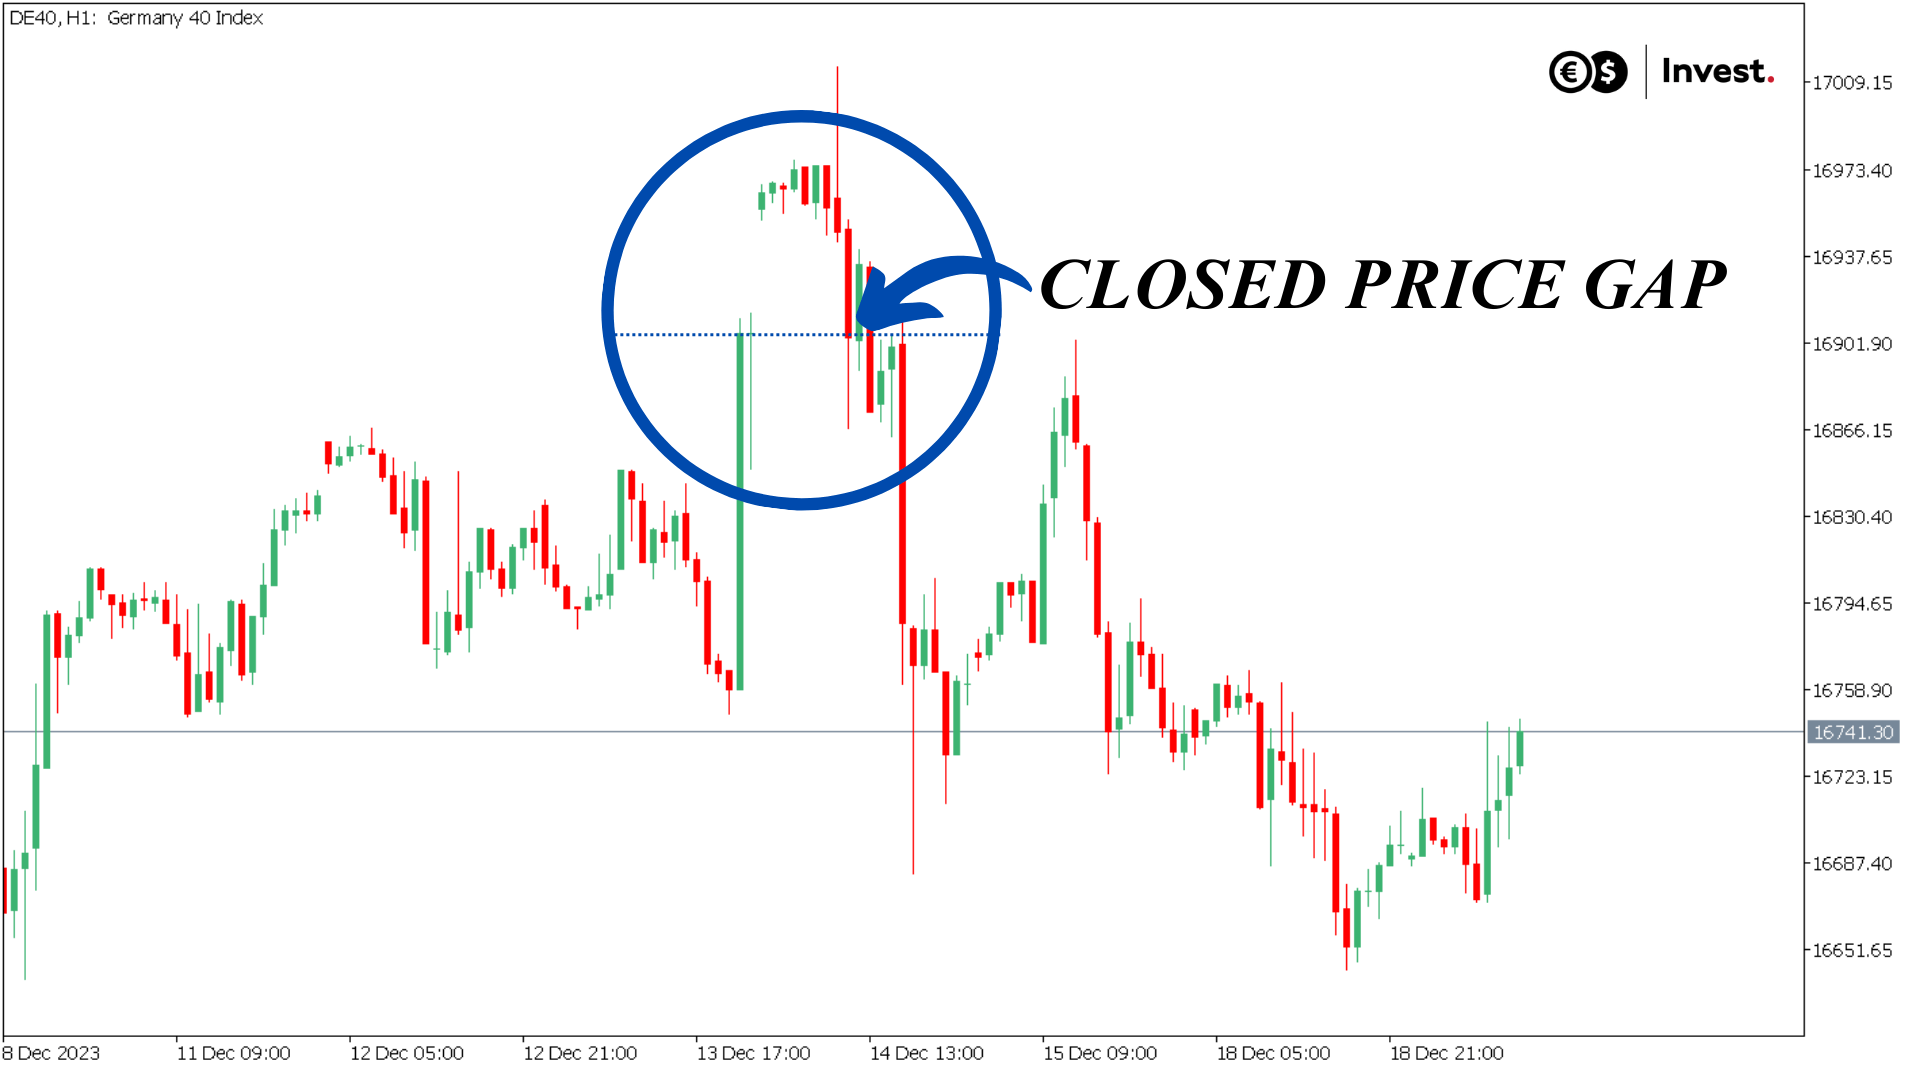
Source: Conotoxia MT5, DE40, H1
From our analysis perspective, it is crucial to understand the timeframe in which price gaps tend to close. Therefore, let's examine how often price gaps close during the same day and week.
For a price gap on the S&P 500 index of:
- At least 0.1% we observed that it closed in 44.4% of cases during the same day and in 73% of cases during the week.
- For a gap of at least 0.3%, closing occurred on the same day in 33.1% of cases and during the week in 65% of cases.
- As for a gap of 0.5%, closing occurred on the same day in 27.5% of cases and during the week in 62% of cases.
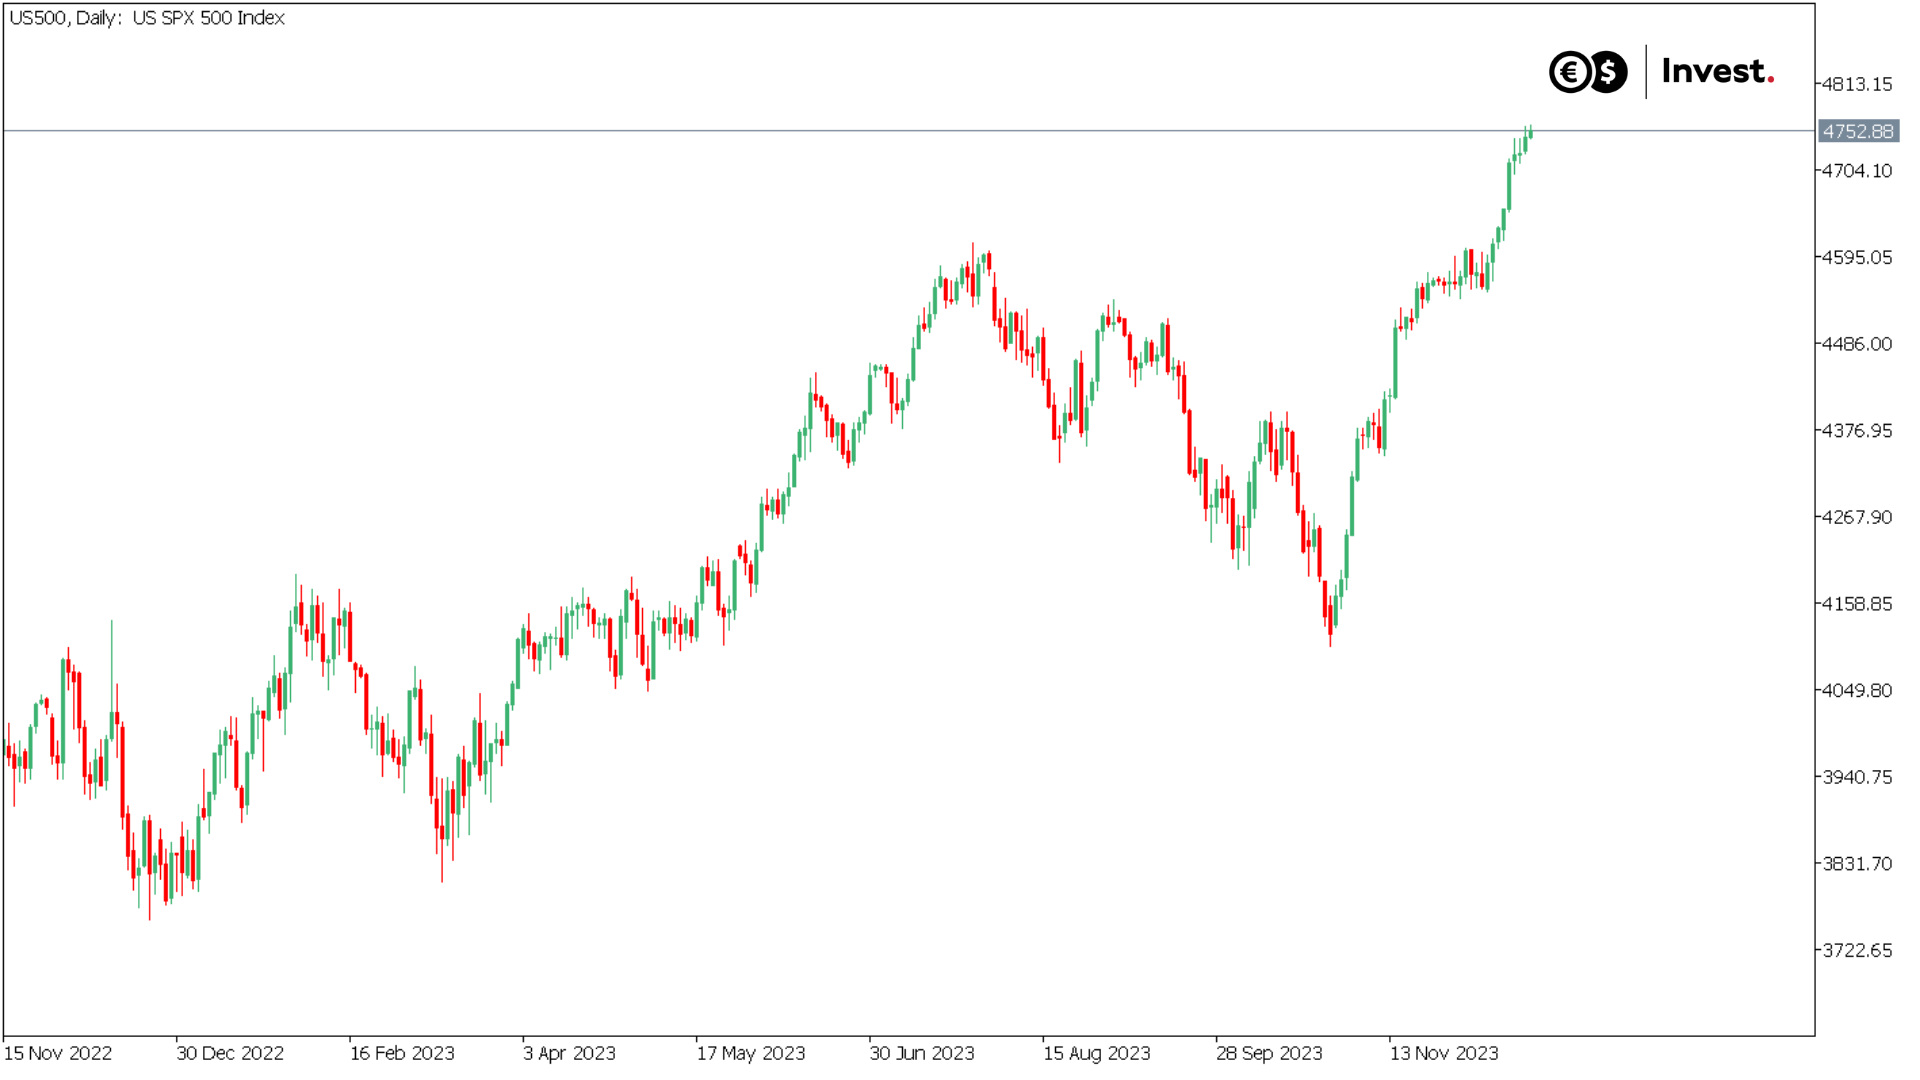
Source: Conotoxia MT5, US500, Daily
It's worth emphasizing that the study did not reveal significant differences in terms of the type of gap, whether it was an upward or downward gap.
For the Nasdaq 100 index, price gaps of:
- At least 0.1% we observed that they closed in 53.3% of cases on the same day and a remarkable 80% of cases during the week.
- For a gap of at least 0.3%, closing occurred on the same day in 50.4% of cases and during the week in three out of four cases (75%).
- As for a gap of 0.5%, closing occurred on the same day in 44.5% of cases and during the week in an impressive 71% of cases.
This means that the Nasdaq 100 index shows a significantly greater tendency to "close" price gaps than the S&P 500 index.
What might be interesting is for the German DAX 40 index, which most frequently has price gaps, we observed that they have the lowest tendency to close. For a price gap of:
- At least 0.1% closing occurred in only 29.5% of cases on the same day and in 65% of cases during the week.
- For a gap of at least 0.3%, closing occurred on the same day in one out of five cases (19.4%), and during the week in half of the cases (57%).
- As for a gap of 0.5%, closing occurred on the same day in only 13.5% of cases and during the week in 50% of cases.
This means that the emergence of a price gap on the DAX 40 index typically effectively signals a change in direction until the end of the day.
How could we utilize price gaps in our trading?
It turns out that both the frequency of price gaps and their tendency to "close" vary significantly depending on the specific index in which we are investing. Understanding this phenomenon could allow us to better adapt to trading a particular financial instrument, thereby potentially increasing the effectiveness of our investments.
For the S&P 500 index, price gaps occur relatively infrequently, as even the smallest gaps (at least 0.1%) are observed only in one out of five sessions. When it comes to larger gaps, for example, of 0.5%, their "closing" happens only in one out of four cases on the same day (27.5%). This could be a significant factor in forecasting the continuation of a trend.
In the case of the technological Nasdaq 100 index, we observe the highest effectiveness in "closing" price gaps, occurring from every second to every fourth session. Most frequently, 0.1% size gaps close in as much as 80% of cases during the week.
The German DAX 40 index is characterized by the most frequent occurrence of price gaps, happening in four out of five openings. Despite this frequency, this index exhibits the lowest tendency to "close" price gaps (only in 29.5% of cases within a day). This makes it seem most susceptible to trend determination by price gaps.
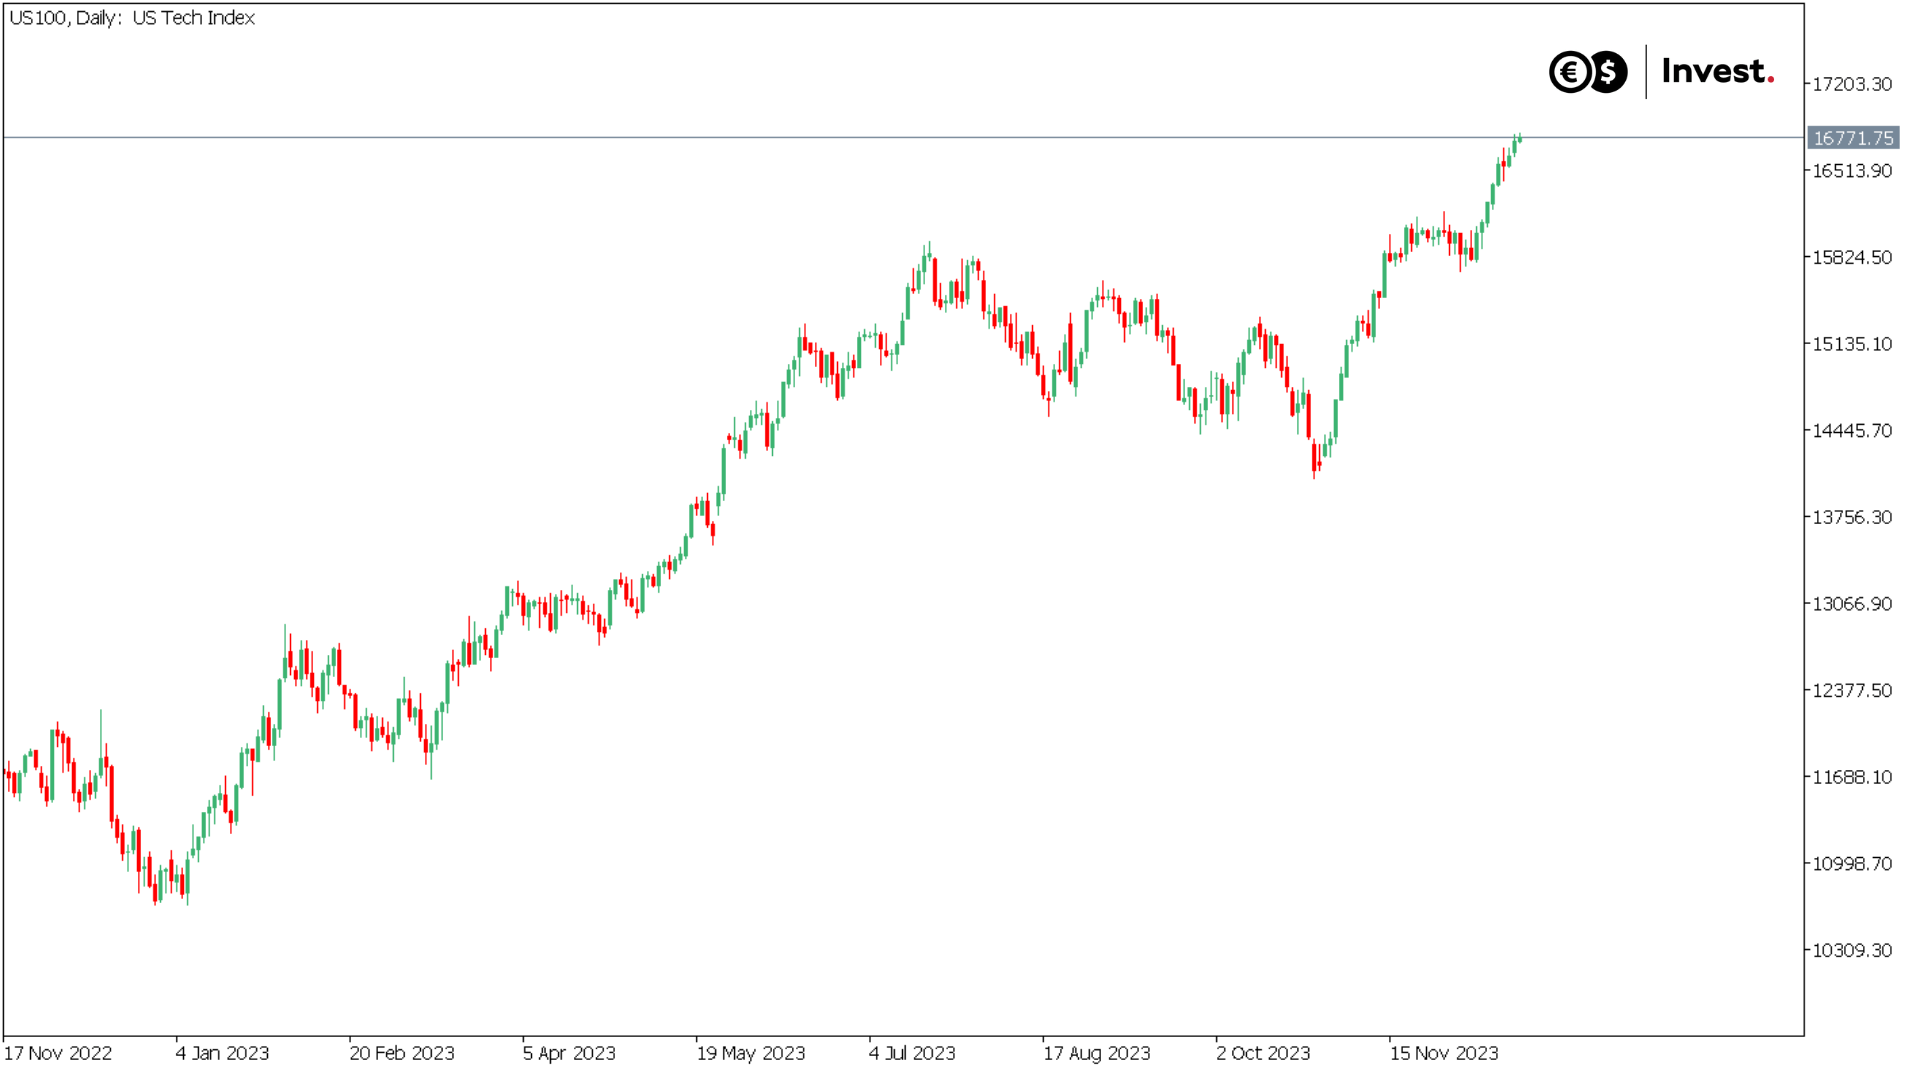
Source: Conotoxia MT5, US100, Daily
Grzegorz Dróżdż, CAI MPW, Market Analyst of Conotoxia Ltd. (Conotoxia investment service)
Materials, analysis and opinions contained, referenced or provided herein are intended solely for informational and educational purposes. Personal opinion of the author does not represent and should not be constructed as a statement or an investment advice made by Conotoxia Ltd. All indiscriminate reliance on illustrative or informational materials may lead to losses. Past performance is not a reliable indicator of future results.
CFDs are complex instruments and come with a high risk of losing money rapidly due to leverage. 72.95% of retail investor accounts lose money when trading CFDs with this provider. You should consider whether you understand how CFDs work and whether you can afford to take the high risk of losing your money.
Trade this news from Conotoxia Ltd. platforms
Go to your account