With financial markets in a dynamic state of flux, it is worth taking a look at the recent performance of two key US indices: The S&P 500 and the technology-based Nasdaq 100. After more than two years, both indices have broken All-Time High (ATH). Interestingly, the German DAX 40 index overtook these US giants, reaching its ATH three months earlier. Is it profitable to invest when indices reach historic peaks? How did the markets behave after reaching their ATH? Let's take a closer look at this phenomenon.
Table of contents:
- How often does the ATH appear on the SPX, Nasdaq 100 and DAX 40 indices?
- Is it profitable to invest when indices are reaching All-Time Highs?
- Conclusions
How often does the ATH appear on the SPX, Nasdaq 100 and DAX 40 indices?
If we look at the frequency with which the indices have reached their historical peaks, we notice an interesting trend, which is illustrated in the chart below. We will notice that long periods without historical peaks (usually more than 500 sessions, or about 2 years) are followed by long series during which the indices set new peaks.
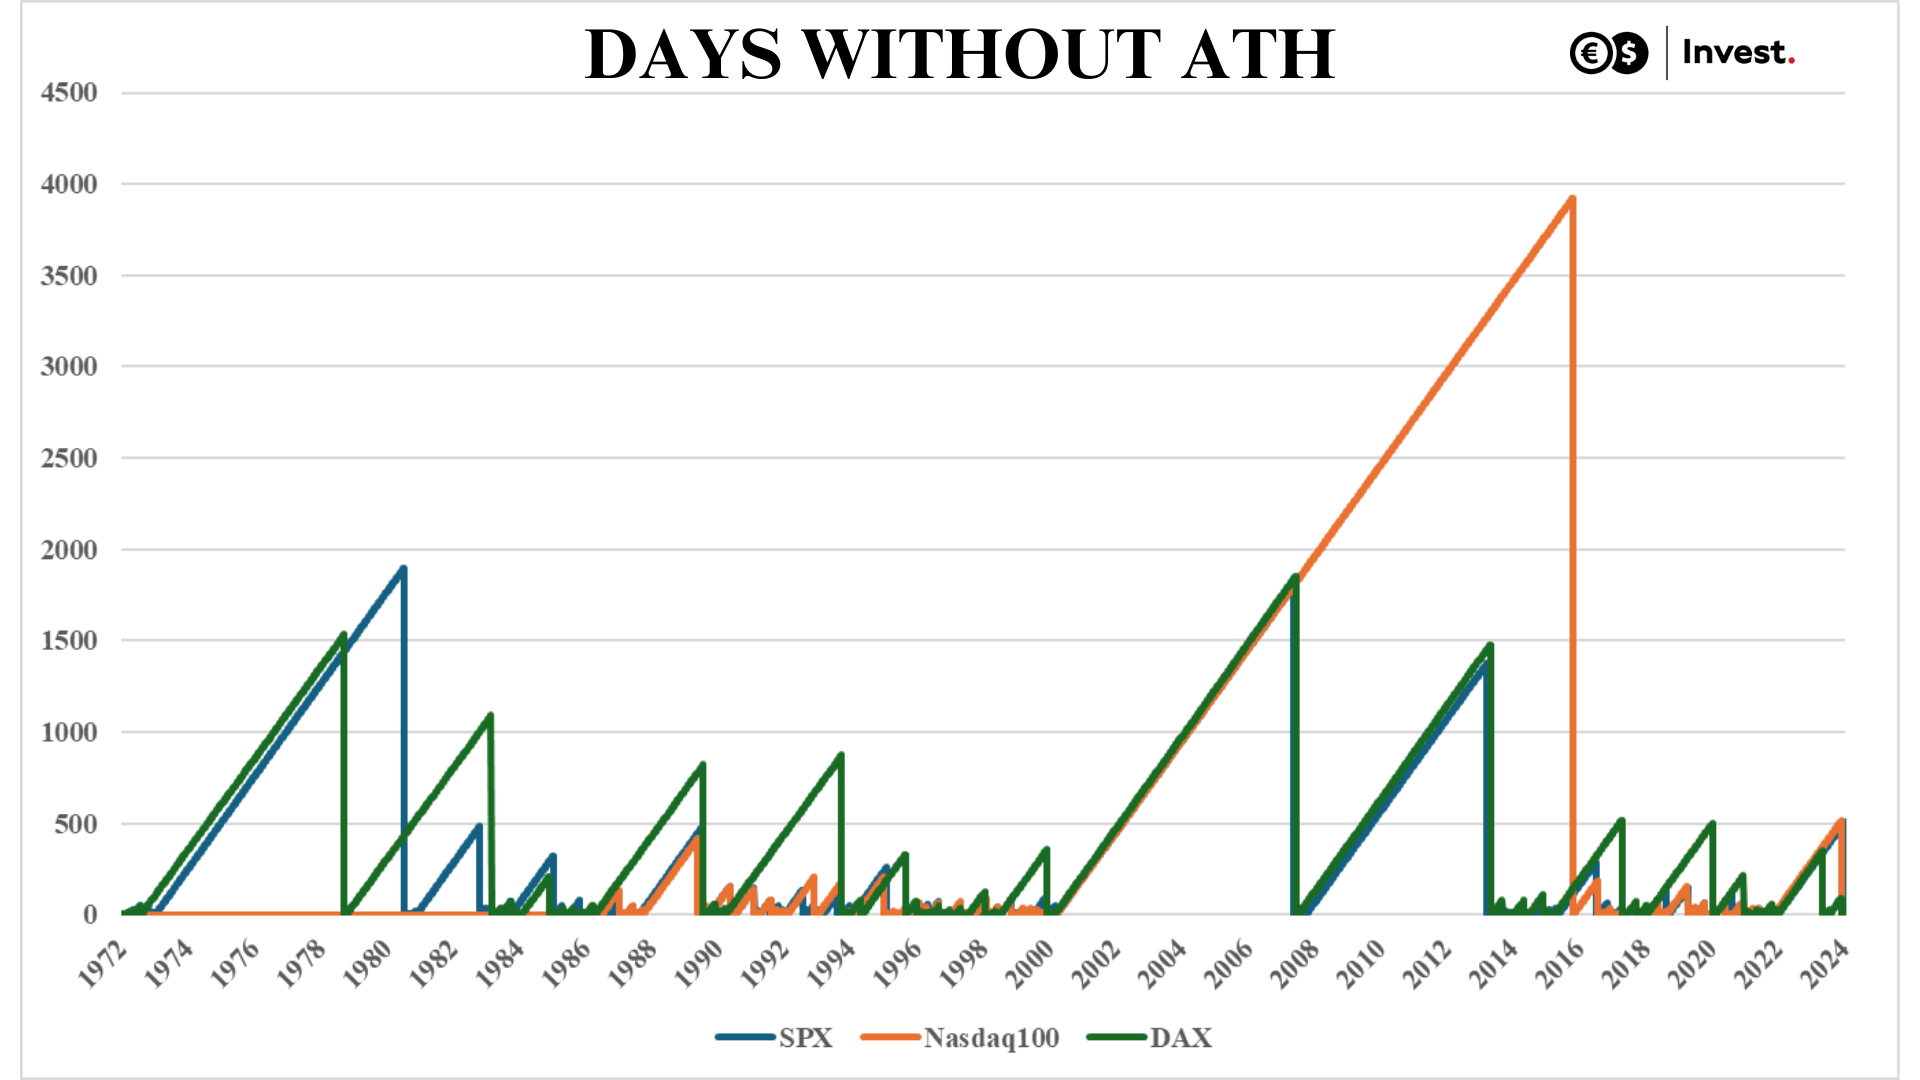
Source: Conotoxia own analysis
Looking at the price data for the major indices since 1971, we note that for the S&P 500 index:
- In 72.9% of the cases after reaching the ATH within 3 consecutive months, the index was above its peaks.
- In 59.5% of the cases after reaching the ATH in the following month, the index remained above its peaks.
- In 55.3% of cases the peaks were reached again after one week (5 trading days).
The Nasdaq 100 technology index seems to have a higher positive susceptibility to set new peaks, which:
- In 74% of cases after reaching the ATH, it remained above its peaks for 3 consecutive months.
- In 65.3% of the cases after reaching the ATH, the index was above its peaks in the following month.
- In 55.8% of cases the peaks were reached again after one week (5 trading days).
These proportions seem to almost reverse on the German DAX 40 index, which:
- In 67.2% of cases after reaching the ATH, it remained above its peaks for 3 consecutive months.
- In 64.2% of cases after reaching the ATH, the index was above its peaks in the following month.
- In 60.7% of cases the peaks were reached again after one week (5 trading days).
Is it profitable to invest when indices are reaching All-Time Highs?
If we look at the returns that the S&P 500 index achieved after reaching new highs, we can see that:
- For 3 consecutive months, the expected value (average change) for the index was positive at 2.7%, with an average increase of 6%, and an average decrease of 7.2%.
- Over a month, the expected value was also positive and was 0.7%, with an average increase and decrease of 3%.
- During the week, the expected value showed no change in the index.
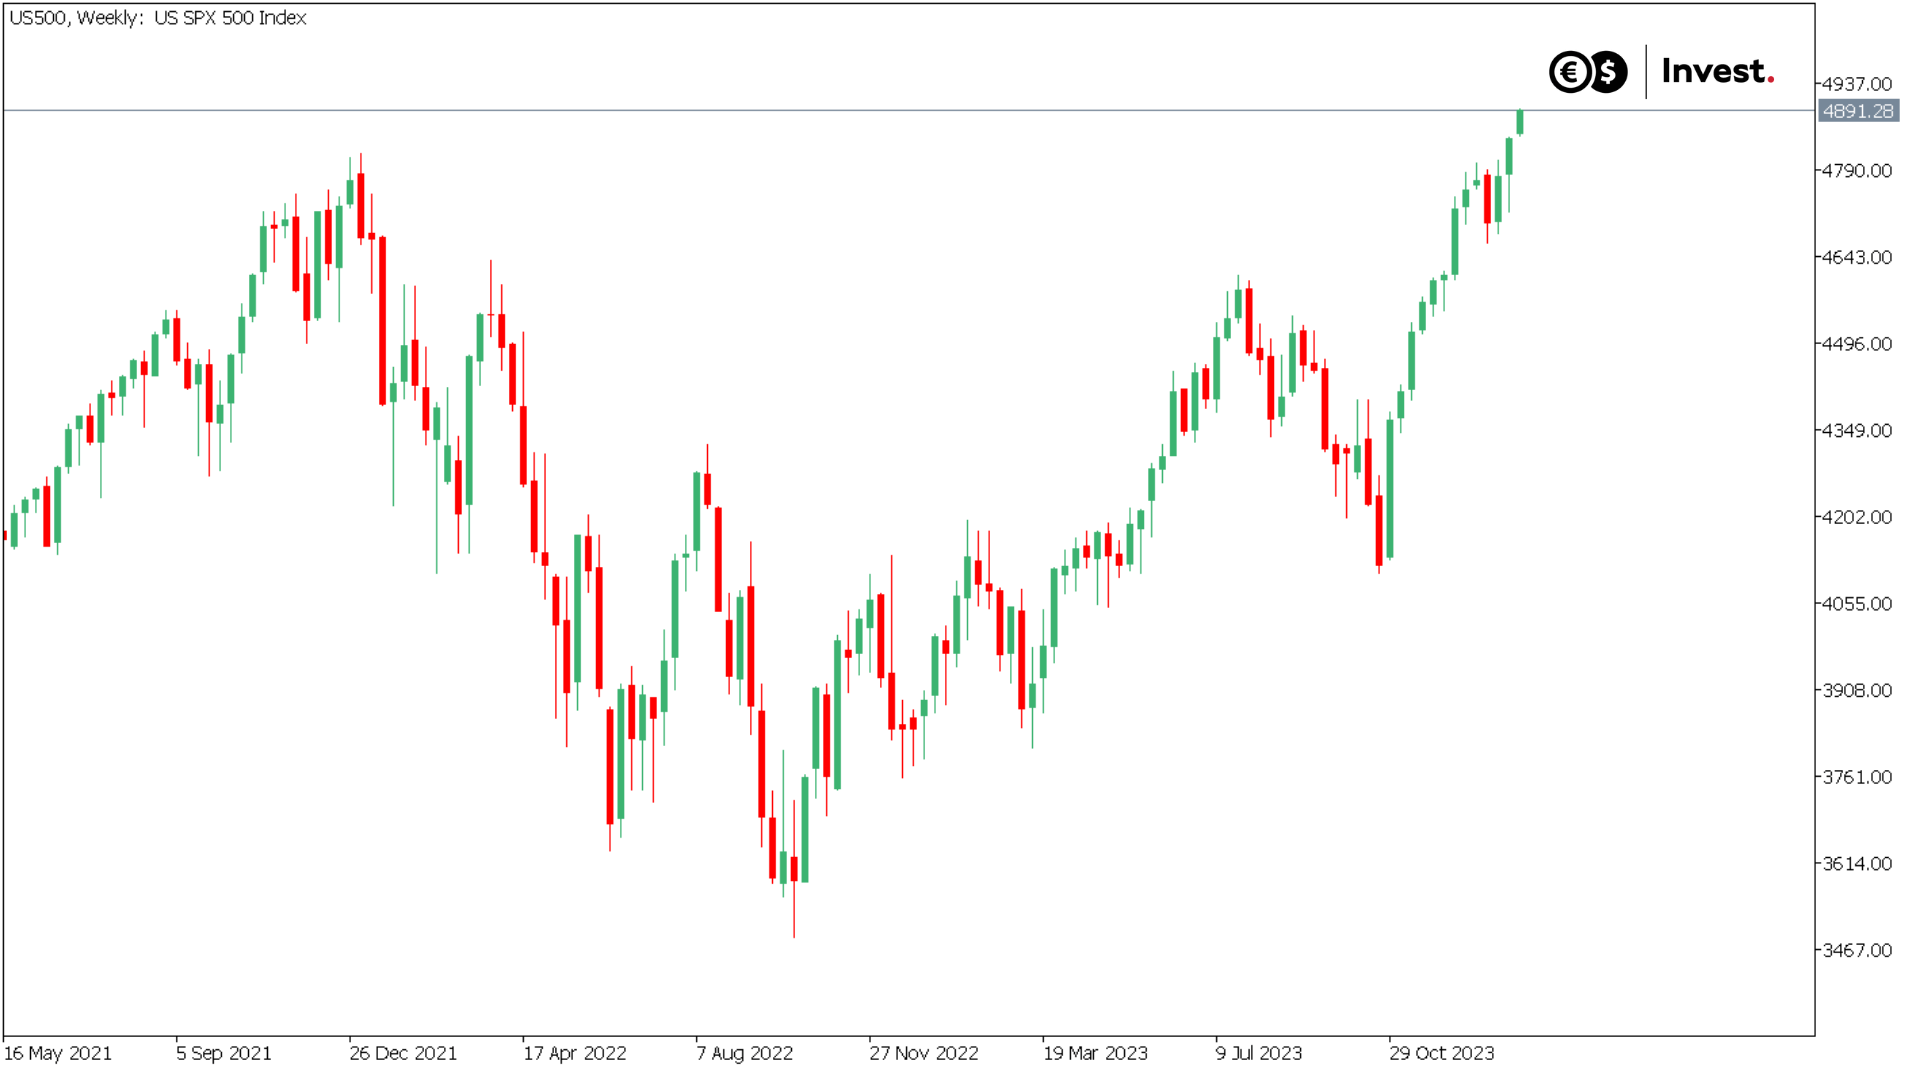
Source: Conotoxia MT5, US500, Weekly
The Nasdaq 100 Index reacted even more favourably after reaching new highs:
- For 3 consecutive months, the expected value for the index was positive at 6.5%, with an average rise and fall of twice that of the S&P 500, at 12%.
- Over one month, the expected value was also positive at 2.3%, with an average increase of 6% and a decrease of 5.6%.
- Over the week, the expected value showed virtually no change in the index (0.1%).
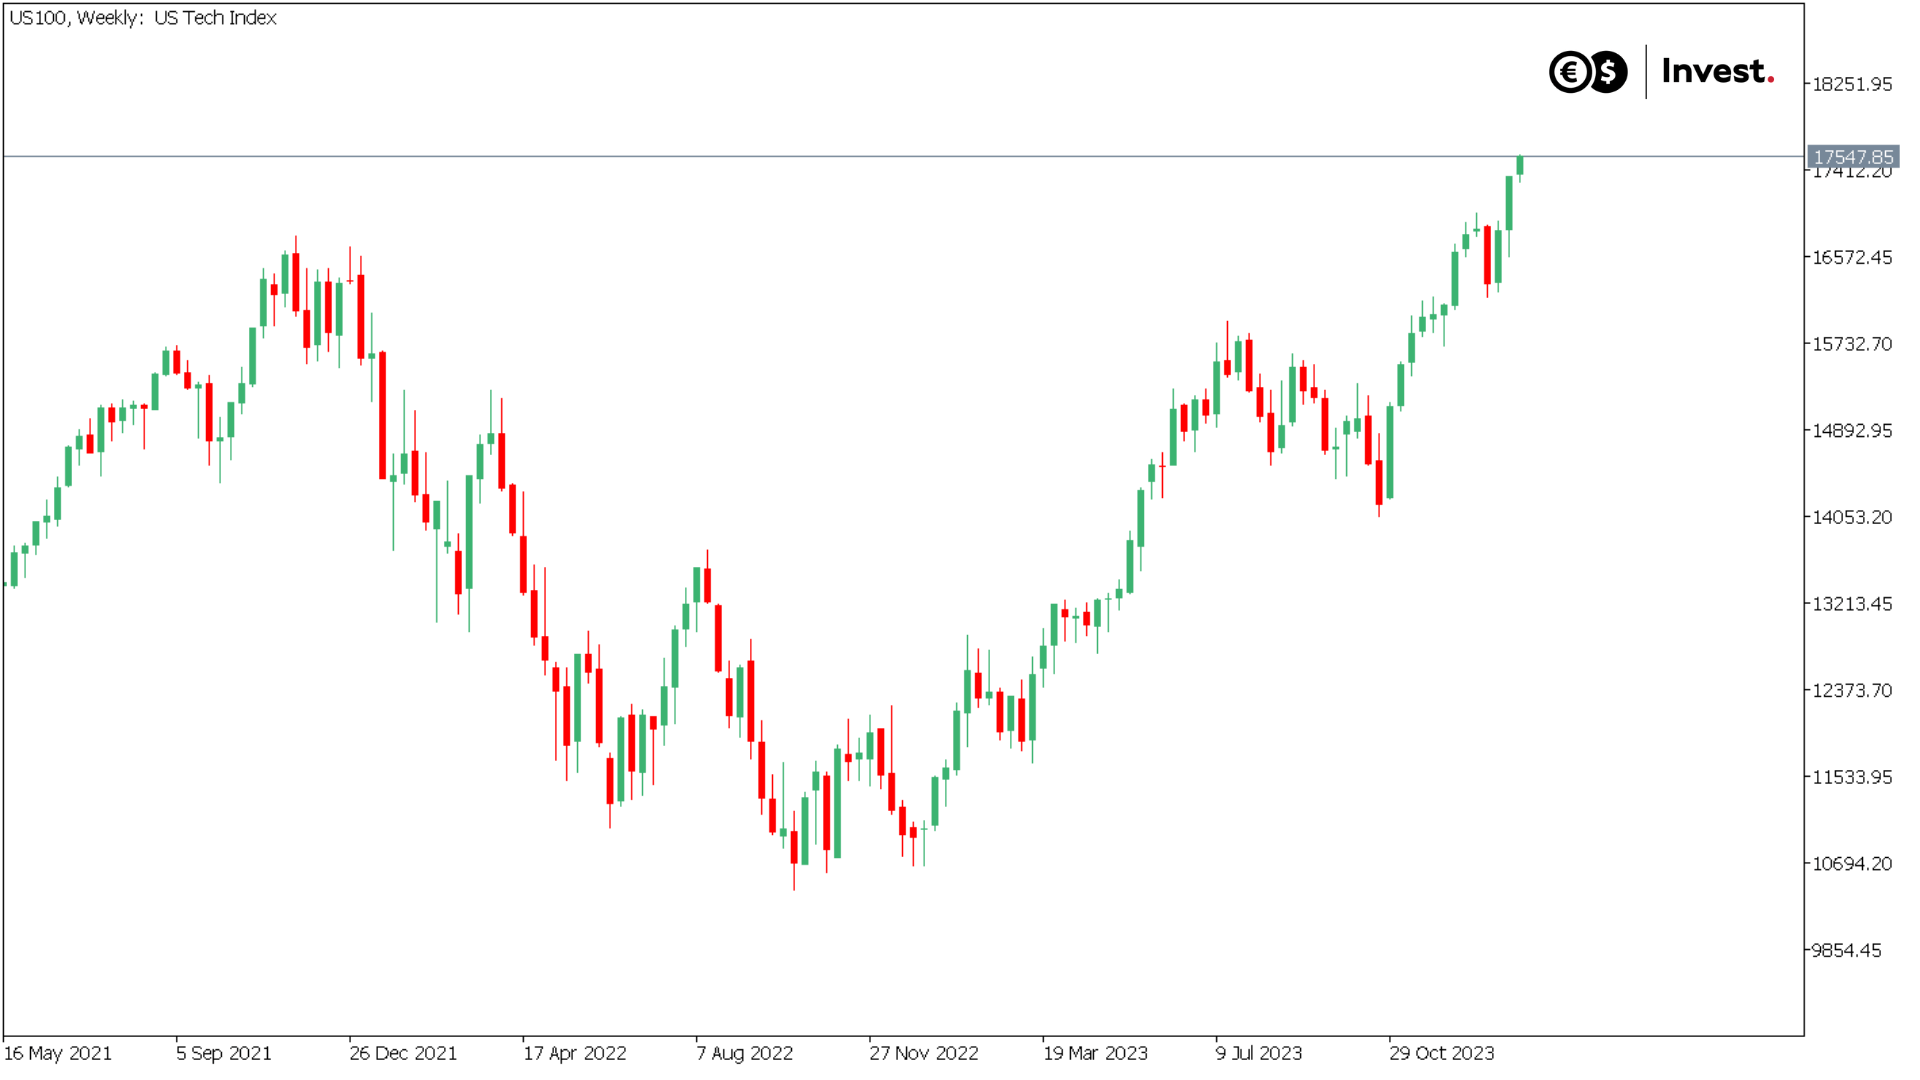
Source: Conotoxia MT5, US100, Weekly
The German DAX 40 index reacted similarly after breaking through the ATH to new highs:
- For 3 consecutive months, the expected value for the index was positive at 5.4%, with an average increase of 12% and an average decrease of 6.9%.
- During the month, the DAX 40 also grew by an average of 1.7%, with an average increase of 6% and an average decrease of 5.6%.
- Over the week, the expected value showed a token increase of 0.4%.
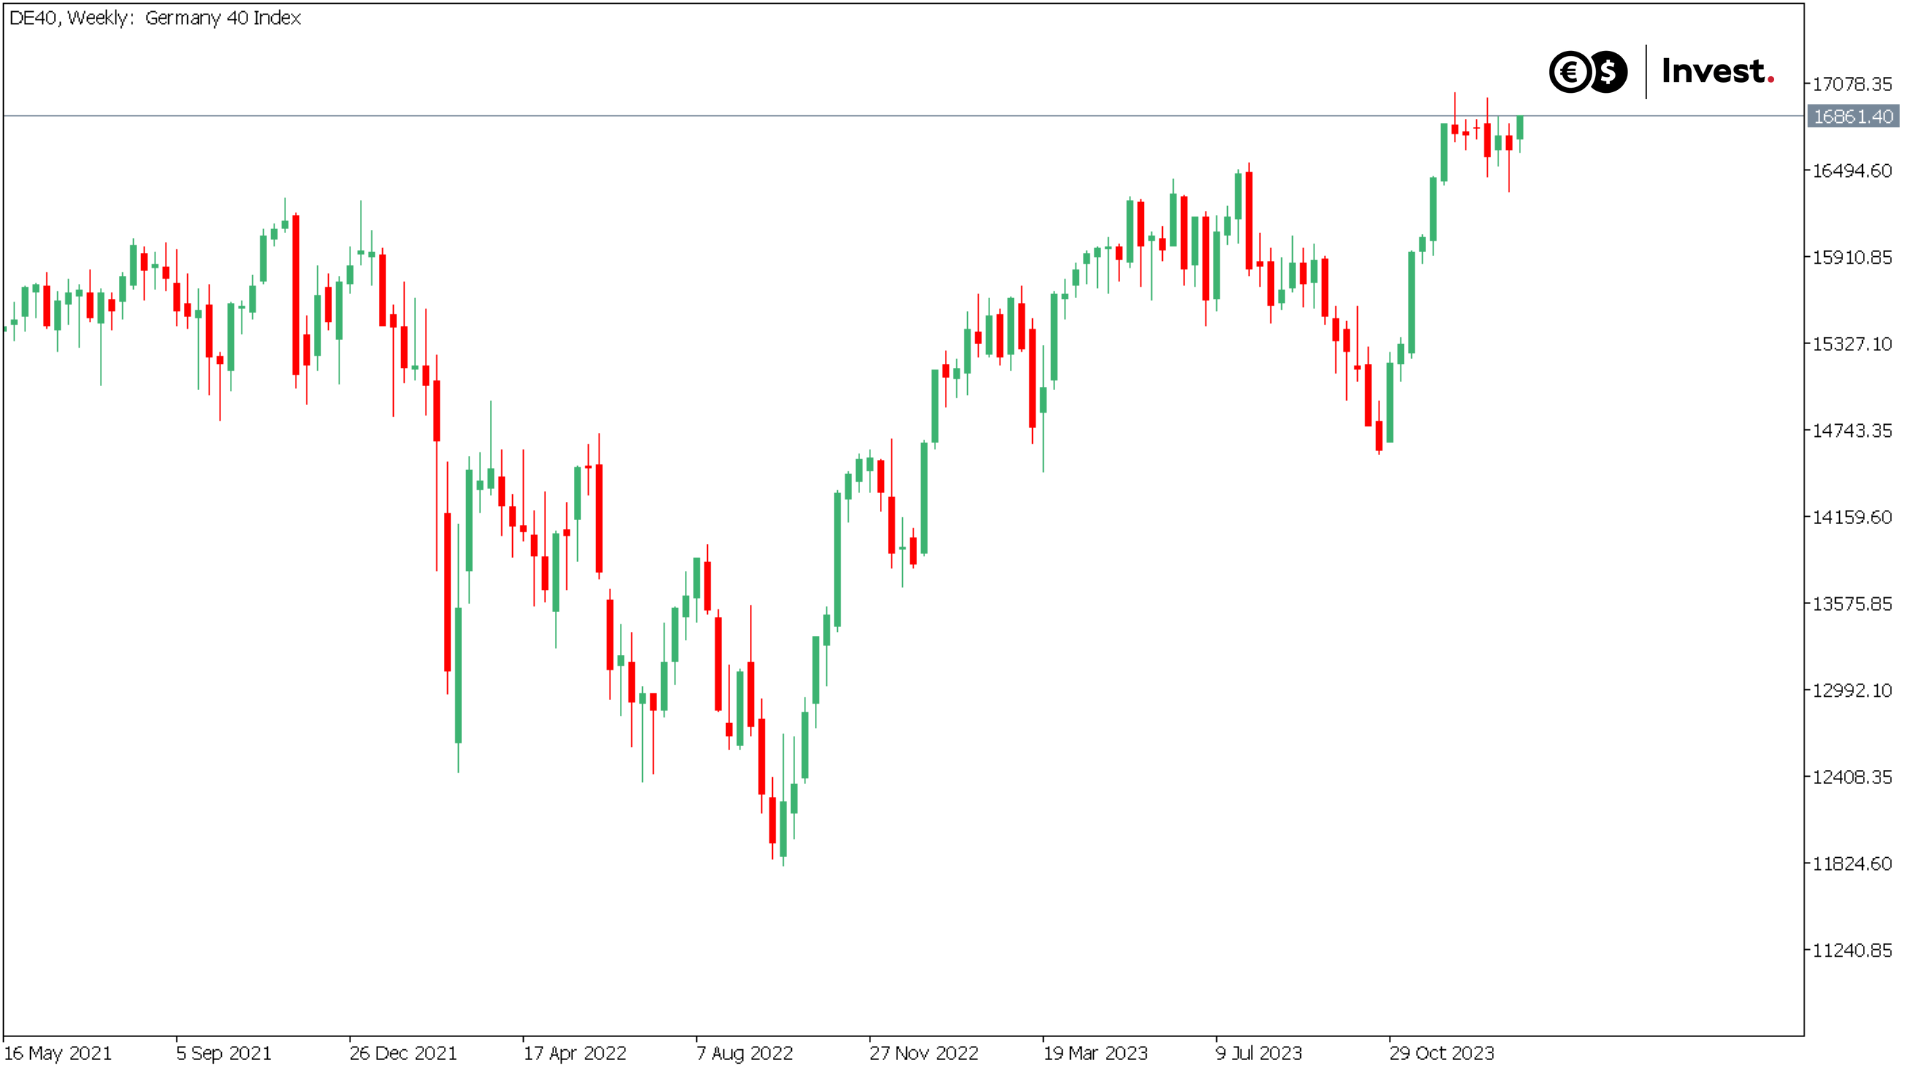
Source: Conotoxia MT5, DE40, Weekly
These correlations can be illustrated in the chart below, showing the distribution of the returns of these indices over the three-month period following the ATH. What is clear is the strong one-sidedness of the Nasdaq 100 and DAX 40 indices, which repeatedly achieved returns in excess of 20% during this period, which was not the case for the S&P 500.
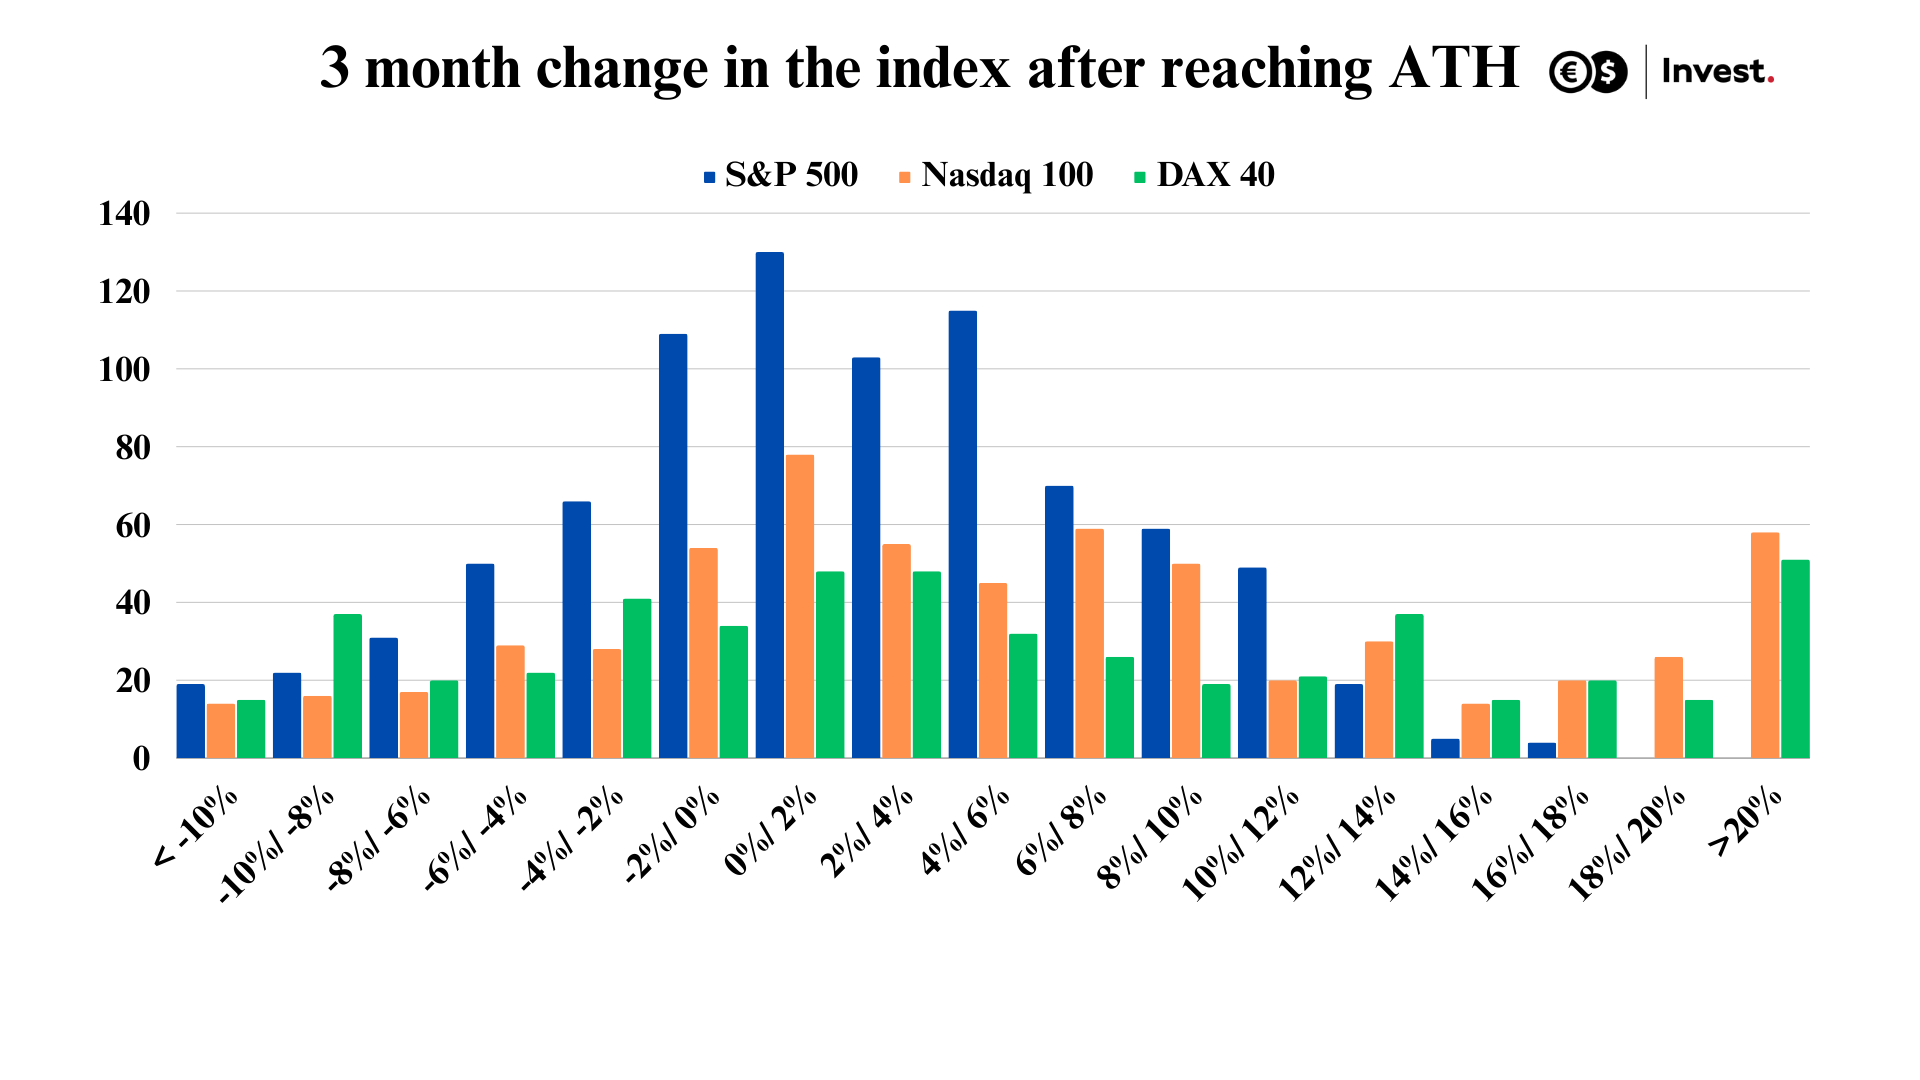
Source: Conotoxia own analysis
Conclusions
Although one cannot take an index buying strategy after reaching historical peaks for granted, there seems to be a strong correlation that can be particularly positive for the Nasdaq 100 and DAX 40 indices. These indices have shown a tendency to outperform their average annual increases in the 3 months after reaching ATH.
Grzegorz Dróżdż, CAI MPW, Market Analyst of Conotoxia Ltd. (Conotoxia investment service)
Materials, analysis and opinions contained, referenced or provided herein are intended solely for informational and educational purposes. Personal opinion of the author does not represent and should not be constructed as a statement or an investment advice made by Conotoxia Ltd. All indiscriminate reliance on illustrative or informational materials may lead to losses. Past performance is not a reliable indicator of future results.
CFDs are complex instruments and come with a high risk of losing money rapidly due to leverage. 71.98% of retail investor accounts lose money when trading CFDs with this provider. You should consider whether you understand how CFDs work and whether you can afford to take the high risk of losing your money.
Trade this news from Conotoxia Ltd. platforms
Go to your account