If we were to look at the analysts' forecasts available on Finviz, we would see that, at current valuations, we cannot speak of an over- or undervaluation of the S&P 500 index, as we have already had the opportunity to write about. However, we decided to dig deeper and analyse valuations at the level of individual sectors, such as technology, financials, consumer goods, energy or communication services.
Table of contents:
- Value of the technology sector (XLK)
- Value of the consumer sector (XLY)
- Value of the energy sector (XLE)
- Value of the financial sector (XLF)
- Value of the communication services sector (XLC)
Value of the technology sector (XLK)
The projected average annual earnings growth rate for the S&P 500 (US500) index shares over the next five years is 7.9%, with a rate of 79% for the distribution of profits to shareholders in the form of dividends and share buyback programmes. Under these assumptions, the value of the S&P 500 would be around 4260, which is around the current values of the index.
However, if we break it down by sector, we can see that some sectors are showing signs of overvaluation, while others are showing potential for growth. When analysing analysts' forecasts for future earnings, the technology sector is currently the most overvalued. The forecasts assume an average annual earnings growth rate of 14.4%, with a relatively high earnings reinvestment rate of 54.22% (earnings payout rate of 45.78%). However, a significant problem for the sector is the level of debt, as measured by the debt-to-equity ratio, which is above average at 1.86. This means that technology companies currently have almost twice as much debt as equity, which can significantly increase the future risk of their business. This, in turn, could result in an increase in the expected cost of capital from 8.7% for the S&P 500 index to 12.2% (4.6%+1.86*[8.7%-4.6%]) for technology companies. In that case, the Technology Select Sector SPDR Fund (XLK) would be worth 28.24, well below current values. This may mean that it is difficult to expect technology stocks to generate as high returns in the coming years as they have done since 2008.
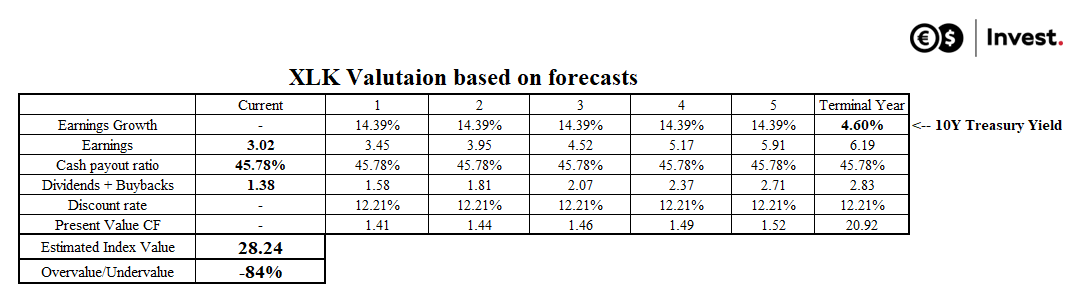
Source: Conotoxia (own analysis)
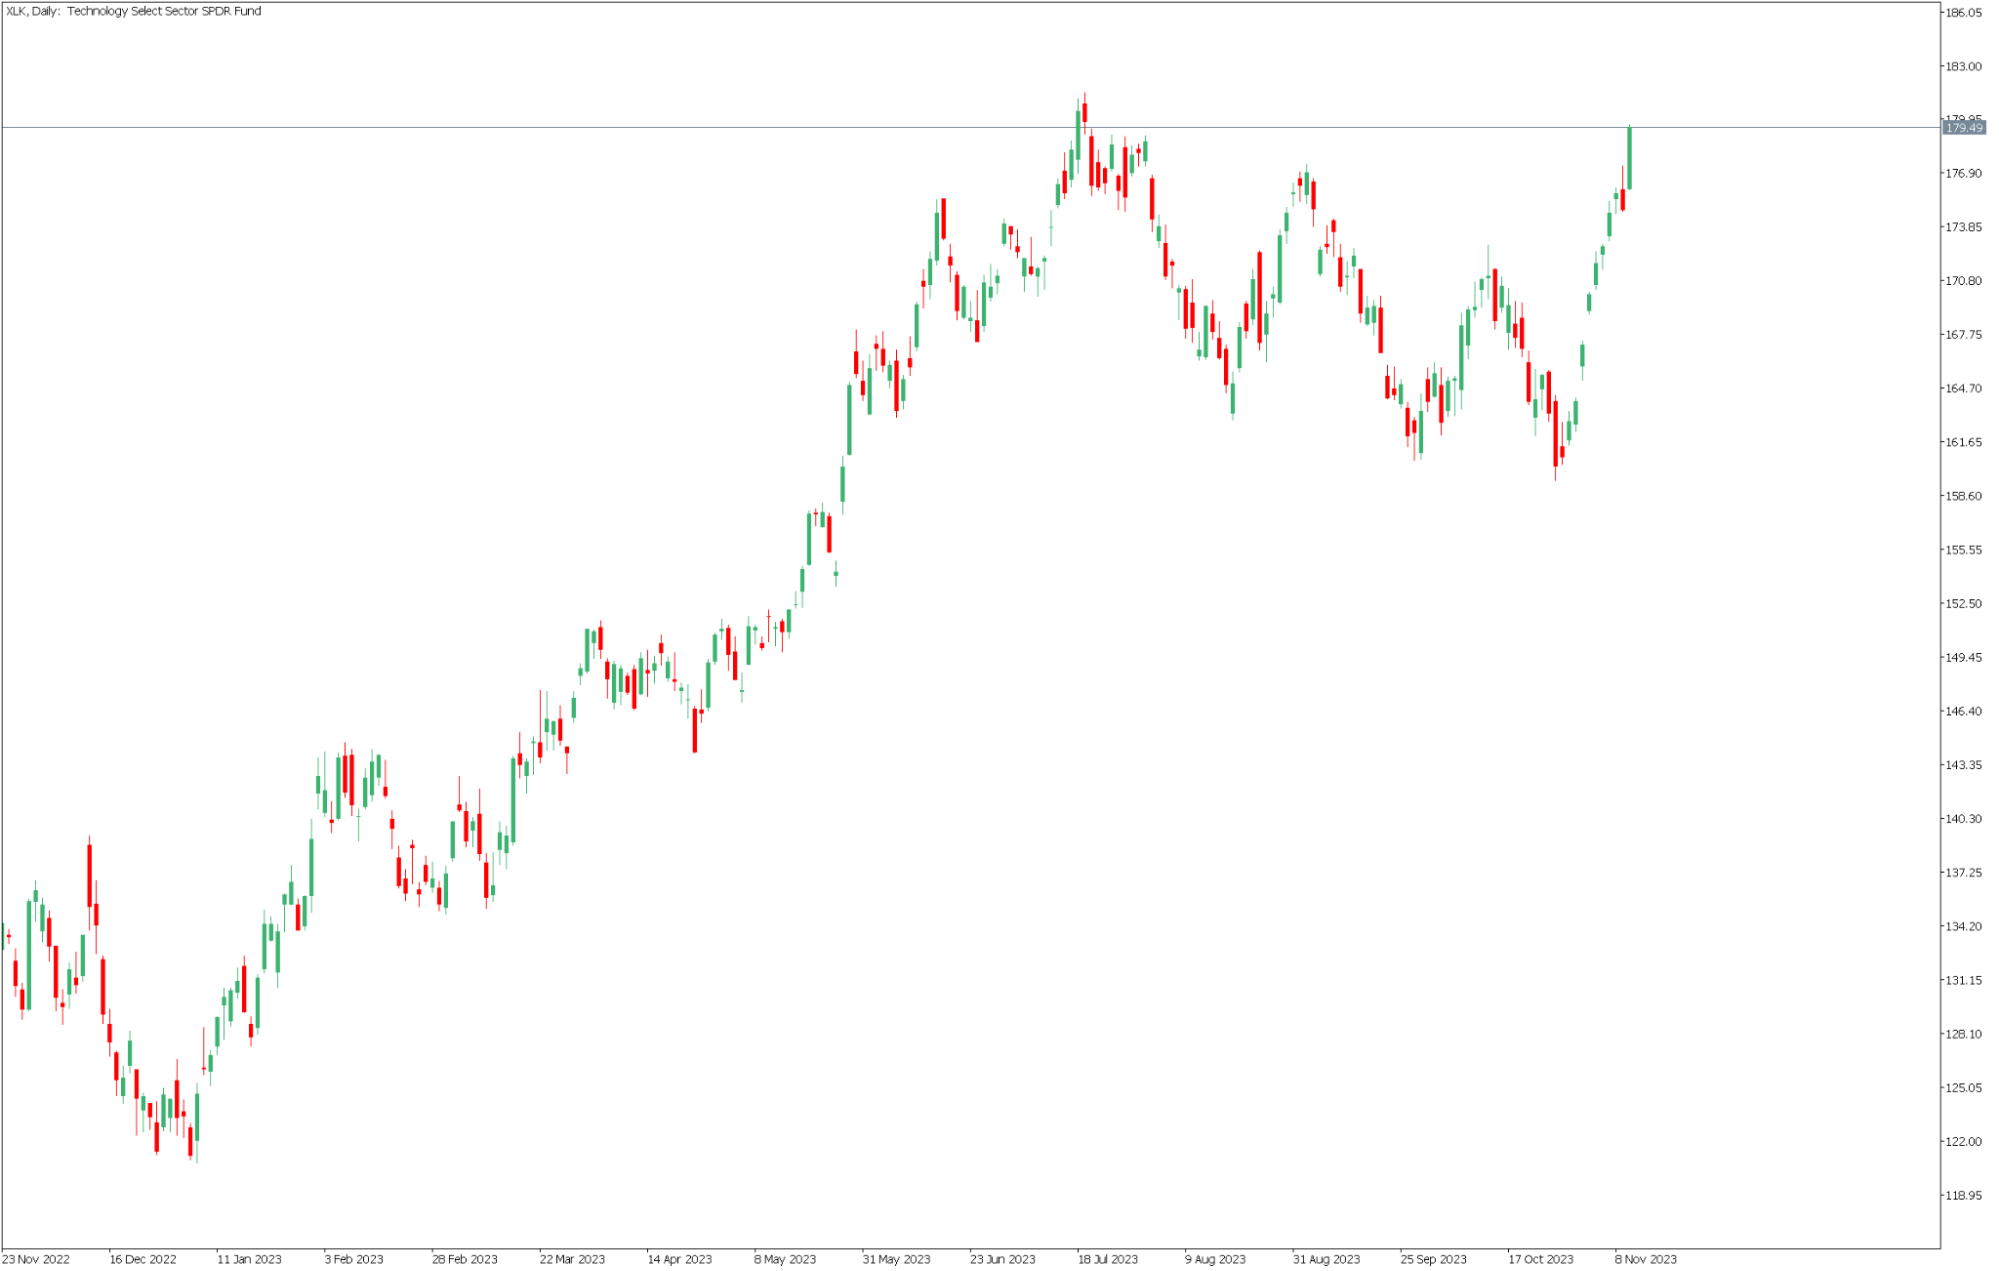
Source: Conotoxia MT5, XLK, Daily
Value of the consumer sector (XLY)
The situation in the consumer goods sector is similar. It is characterised by some of the highest debt-to-equity ratios at 2.29, significantly raising the cost of capital to 14%. The projected average annual earnings growth rate for shares in this sector is 11%, with one of the highest - as high as 94.76%. - earnings payout ratio to shareholders. This means that despite the recovery in the economy, Consumer Discretionary Select Sector SPDR Fund (XLY) equities may face under-investment and high debt distress.
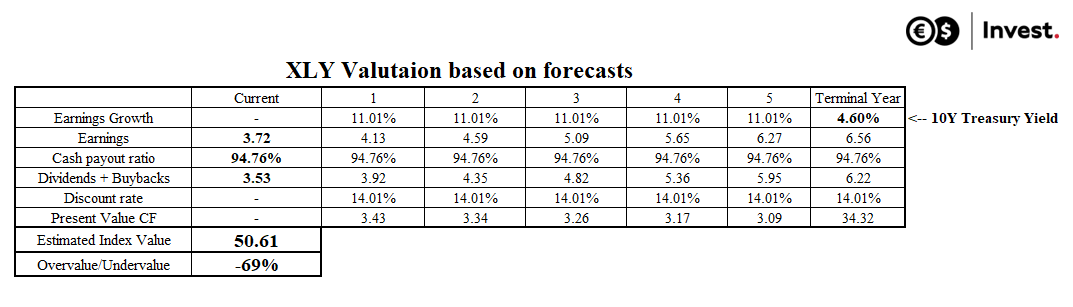
Source: Conotoxia (own analysis)
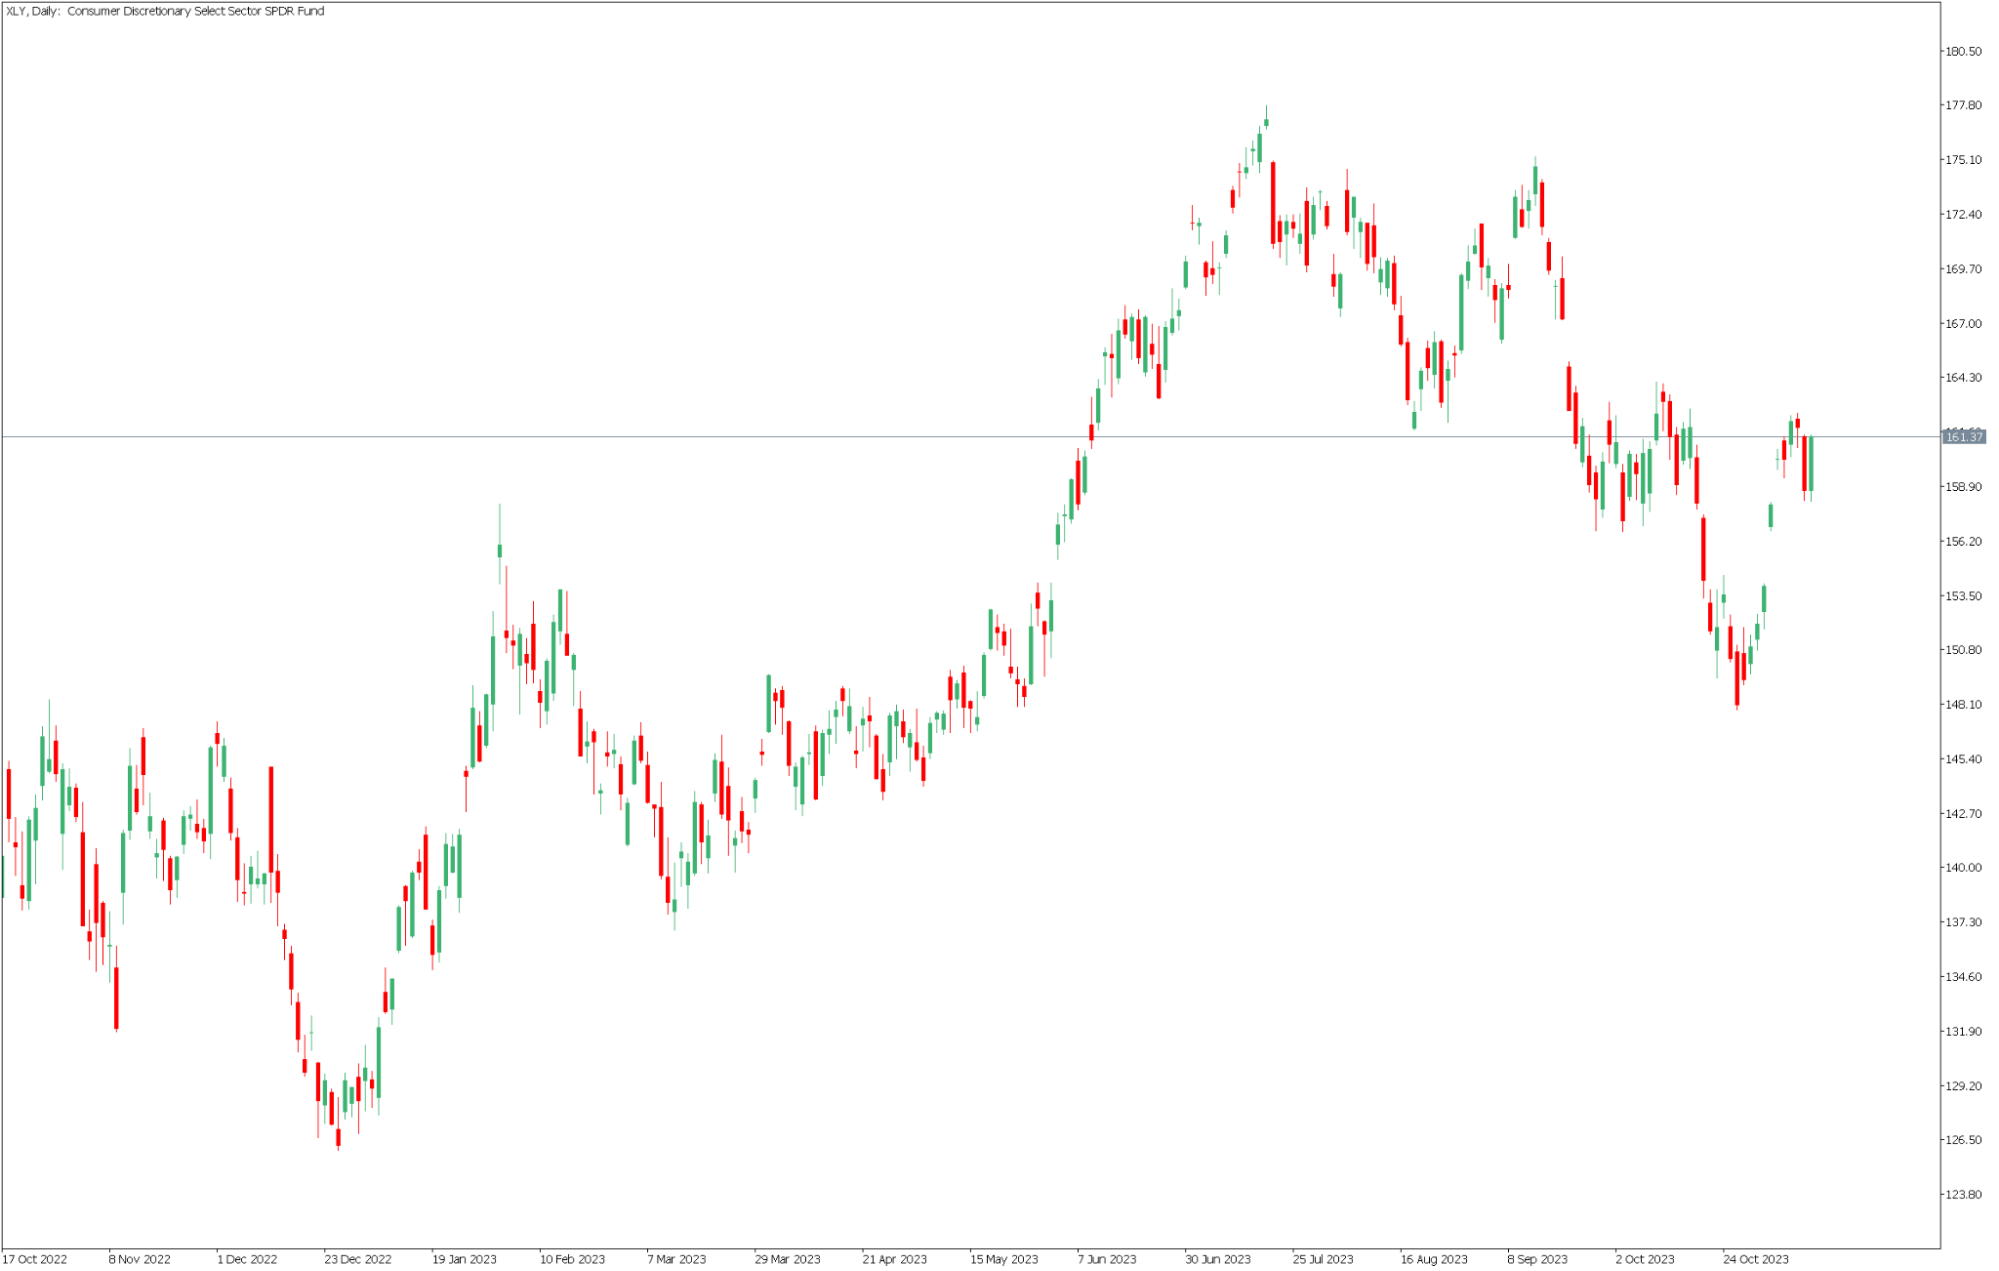
Source: Conotoxia MT5, XLY, Daily
Value of the energy sector (XLE)
According to analysts' forecasts, the values of companies in the energy sector currently look positive. The expected earnings growth rate here is 12.2%, with an earnings payout ratio of 52.22%. These values, combined with relatively low debt levels (debt-to-equity ratio of 0.62), may suggest that stocks from this sector can continue to offer attractive dividend yields to their shareholders while maintaining earnings growth rates similar to those characteristic of technology companies. The assumptions used indicate that the value of the Energy Select Sector SPDR Fund (XLE) is approximately US$130. However, it should be borne in mind that the performance of companies in this sector is strongly dependent on external factors, i.e. commodity and energy price quotations in markets that are characterised by particularly high unpredictability.
Log in and take the opportunity!
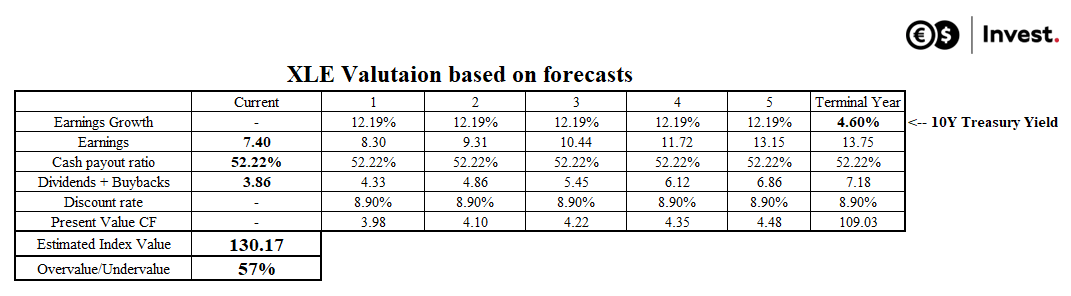
Source: Conotoxia (own analysis)
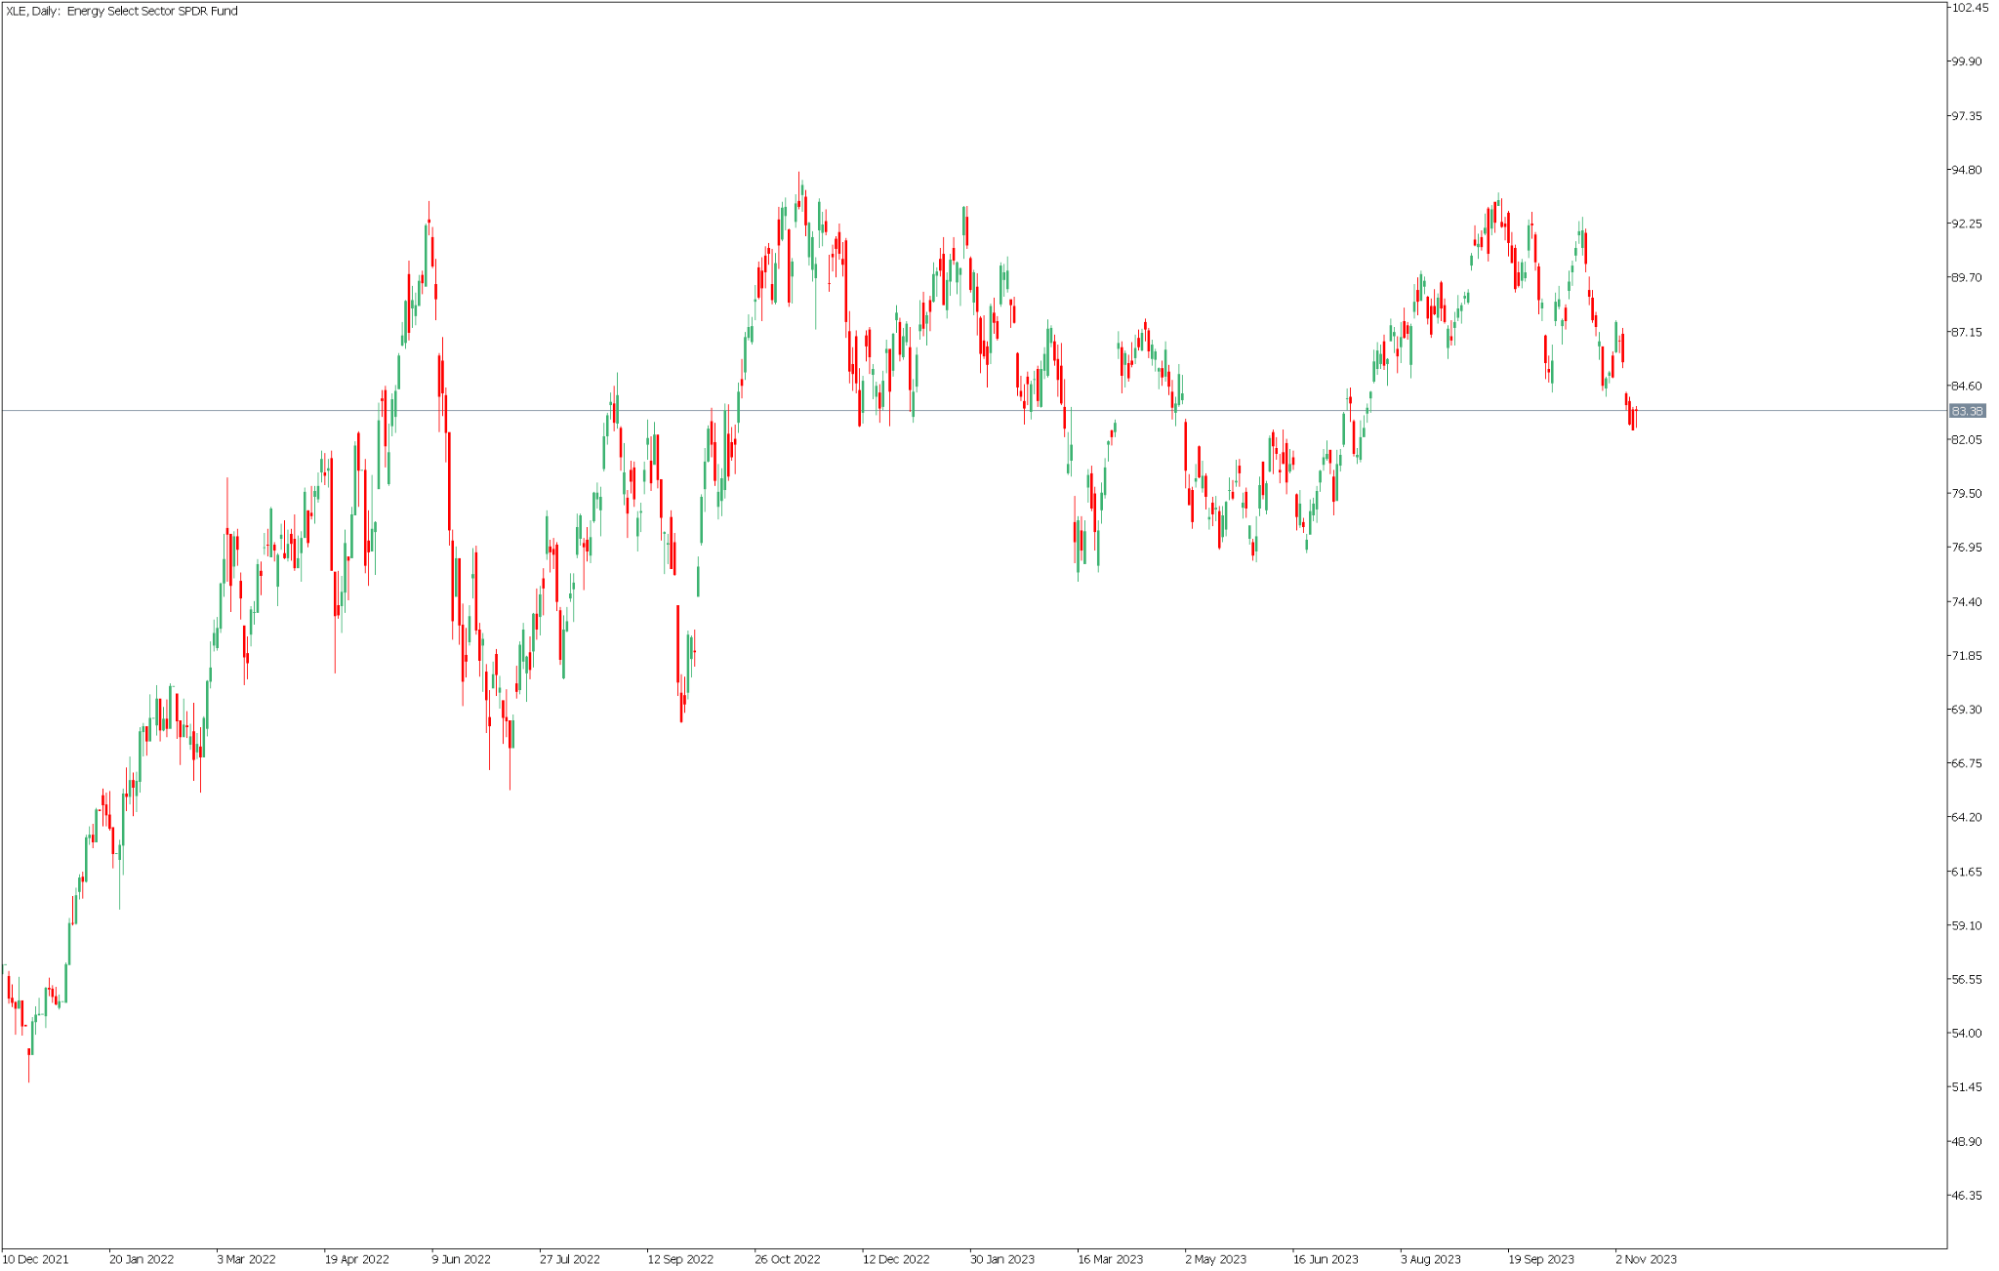
Source: Conotoxia MT5, XLE, Daily
Value of the financial sector (XLF)
As recently as the beginning of this year, we heard about the bankruptcies of large banks in the United States, such as Silicon Valley, which resulted in a significant repricing of the sector. Since then, the situation has been alleviated by liquidity interventions from the Fed. Analysts forecast that average earnings growth in the sector could be one of the higher ones, averaging 11.7% per annum. The average level of reinvestment of equity earnings is this 30.71%, with a relatively low debt-to-equity ratio of 1.19. This would put the cost of capital at 9.5%, suggesting that the Financial Select Sector SPDR Fund (XLF) may currently be showing signs of being undervalued in the market. According to analysts, this means that it has the potential to grow faster than the S&P 500 Index.
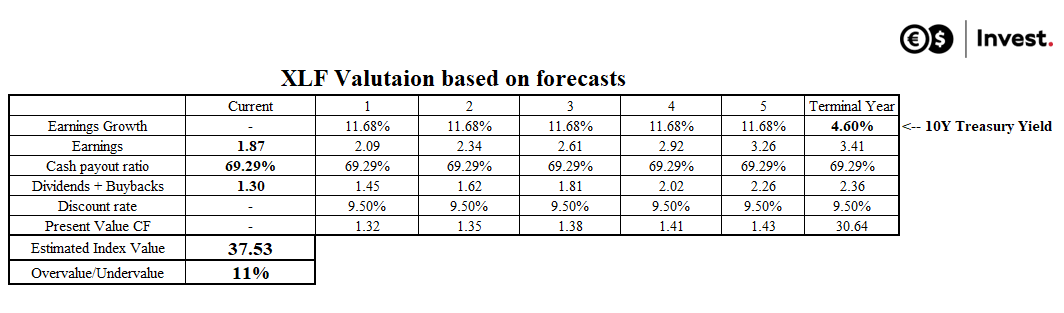
Source: Conotoxia (own analysis)
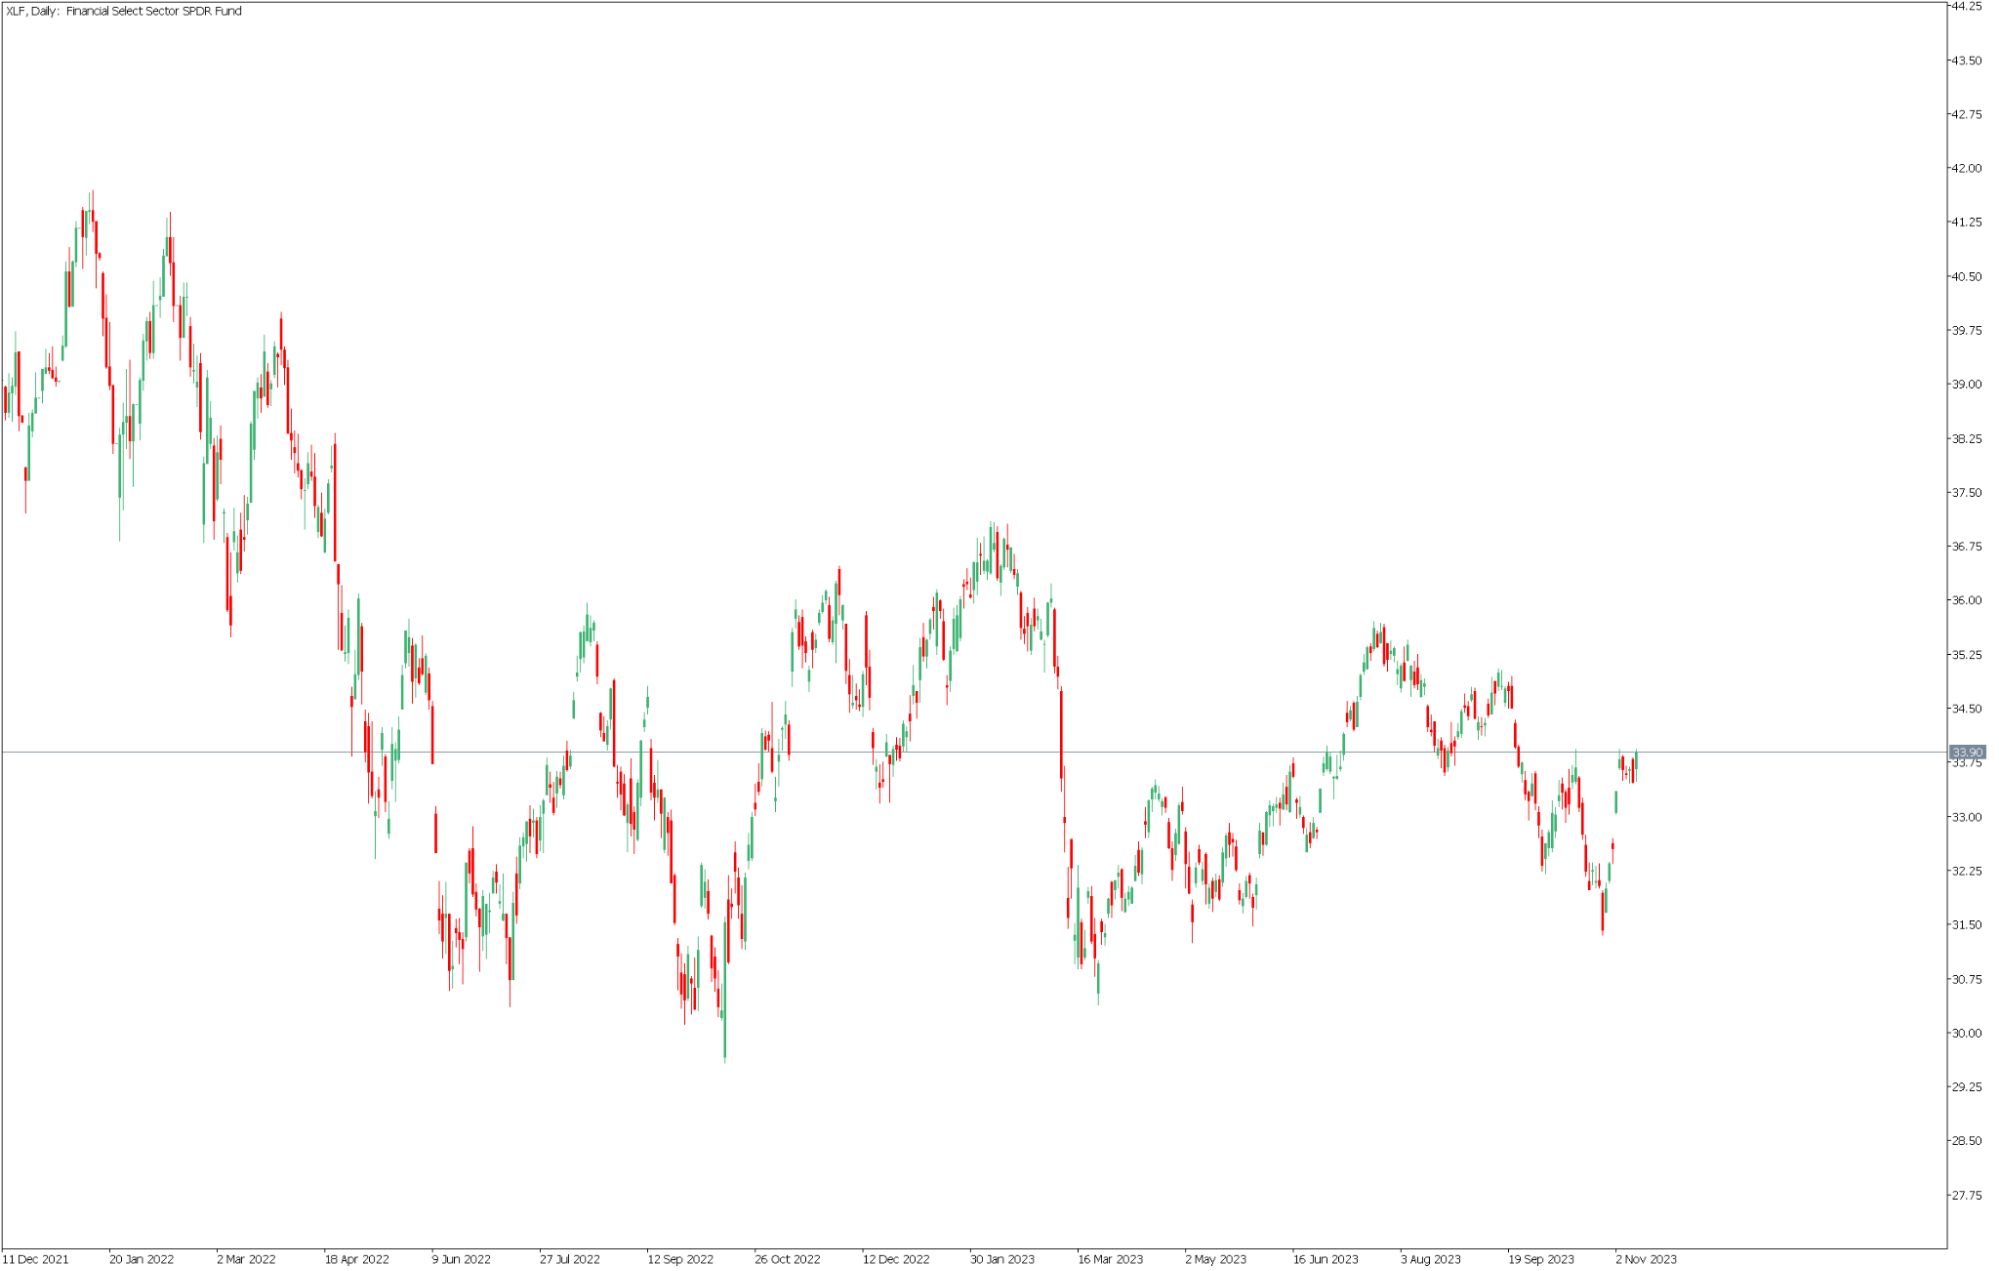
Source: Conotoxia MT5, XLF, Daily
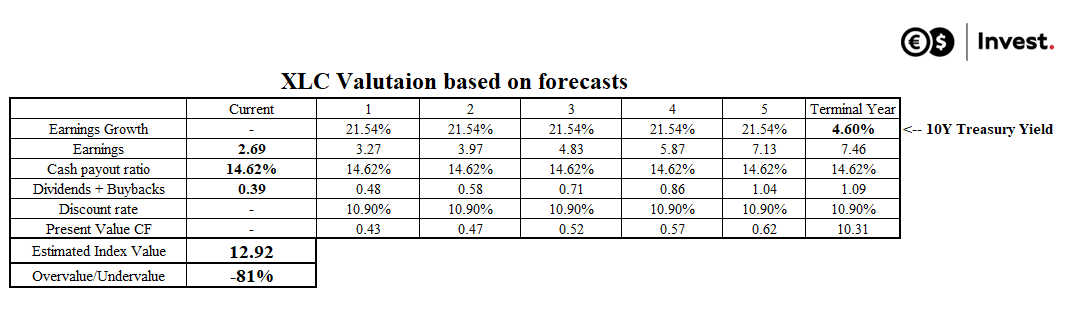
Value of the communication services sector (XLC)
The sector with the highest expected earnings growth rate, according to analysts, is communications services, which includes giants such as Meta (Facebook), Alphabet (Google) and Netflix. The expected average annual growth rate is 21.5%, which largely appears to be generated by the highest level of earnings investment at 85.38%. In addition, companies in this sector have an elevated debt-to-equity ratio of 1.54. This, in turn, raises the expected return to 10.9%. However, despite this high growth potential, the Communication Services Select Sector SPDR Fund (XLC) is showing signs of overvaluation, suggesting that, as with the technology sector, shares in companies in this sector may grow more slowly than they have since 2008.
Source: Conotoxia (own analysis)
Grzegorz Dróżdż, CAI MPW, Market Analyst of Conotoxia Ltd. (Conotoxia investment service)
Materials, analysis and opinions contained, referenced or provided herein are intended solely for informational and educational purposes. Personal opinion of the author does not represent and should not be constructed as a statement or an investment advice made by Conotoxia Ltd. All indiscriminate reliance on illustrative or informational materials may lead to losses. Past performance is not a reliable indicator of future results.
CFDs are complex instruments and come with a high risk of losing money rapidly due to leverage. 72.95% of retail investor accounts lose money when trading CFDs with this provider. You should consider whether you understand how CFDs work and whether you can afford to take the high risk of losing your money.
Trade this news from Conotoxia Ltd. platforms
Go to your account