The earnings season for the third quarter of this year appears to have been a success, exceeding analysts' expectations by as much as 79.5%. This result appears to have been one of the factors that triggered the rises in the stock indices. The S&P 500 index, for example, rose by an impressive 6.4% in just one week. Nevertheless, it is worth considering whether it might still be profitable to invest in the major US indices. We will assess them on the basis of the available forecasts, for as Professor Aswath Damodaran says: "keep your eyes on the price" before making investment decisions.
Table of contents:
What is the value of the SPX index?
To answer the question of the value of any asset, we need to understand the concept of value, which currently has many different definitions. In finance, value is defined as the present value of future cash flows after discounting them to today. Cash flow can be defined as the direct returns that an investor receives from an investment, such as dividends or share repurchase programmes. Discount, on the other hand, is the interest rate that determines the expected return on an investment in terms of risk. Often, the 10-year government bond yield is used as a benchmark for the discount. If equities would generate a lower return than a bond investment, it begs the question: does it make sense to invest in them at all?
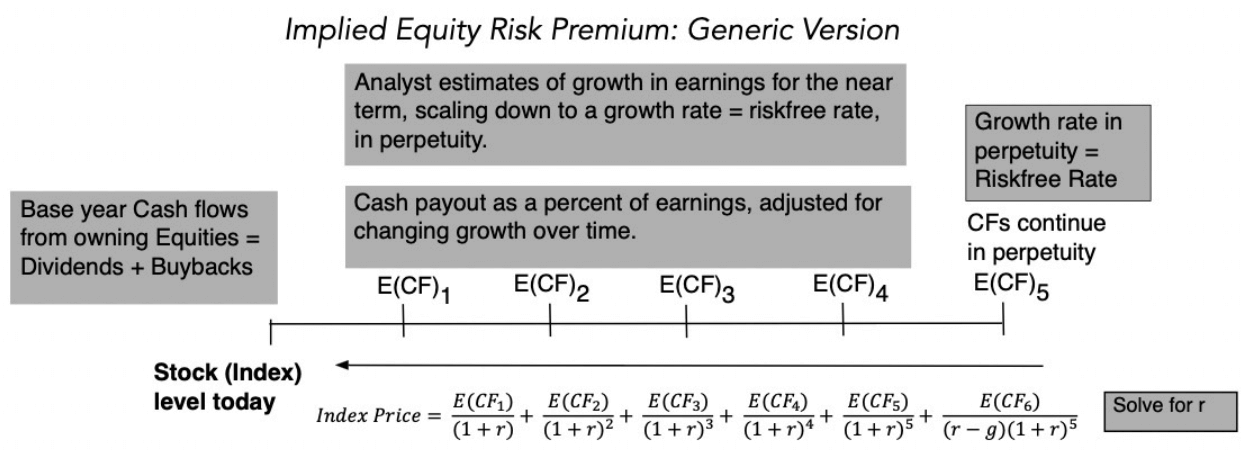
Source: Aswath Damodaran
According to Yardeni Research, the current dividend yield for the S&P 500 index is 1.61%, and most of the returns to investors are paid out in the form of share buyback programmes. The share repurchase rate for the last 12 months is 2.19%. Therefore, the total return to shareholders is 3.73% (1.61% + 2.19%). This represents as much as 79.8% of the index companies' returns, meaning that a significant proportion is paid out to shareholders.
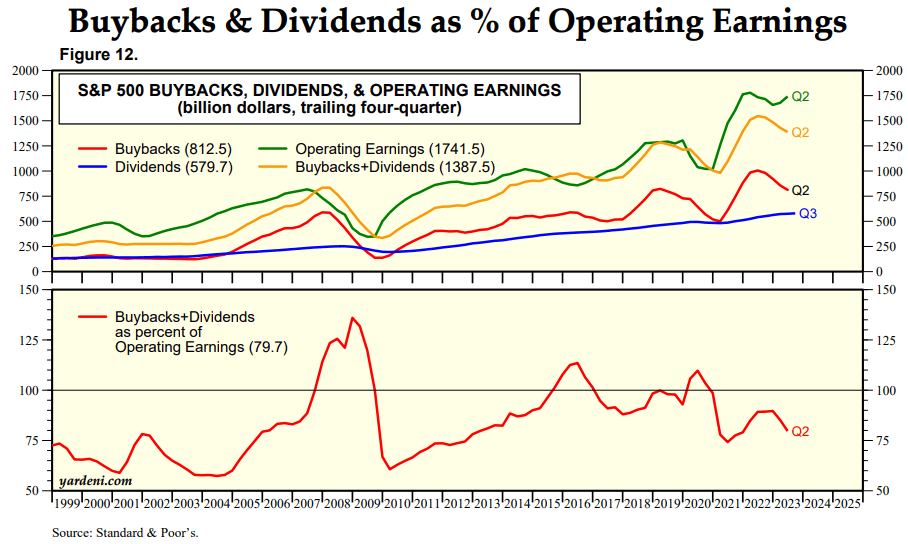
Source: Yardeni Research, Standard & Poor’s
Since 2008, the average annual growth of the S&P 500 index has been 8.7%, which is taken as the discount rate. Standard & Poor's analysts predict that average annual earnings growth over the next five years could be 7.9%. As a result of this calculation, the value of the S&P 500 index would be 4257.67, which is around the current index price. This could mean that the S&P 500 index is currently neither overvalued nor undervalued.
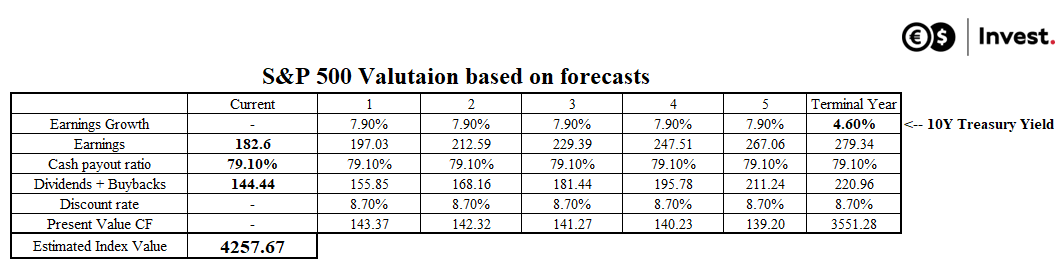
Source: Conotoxia (own analysis)
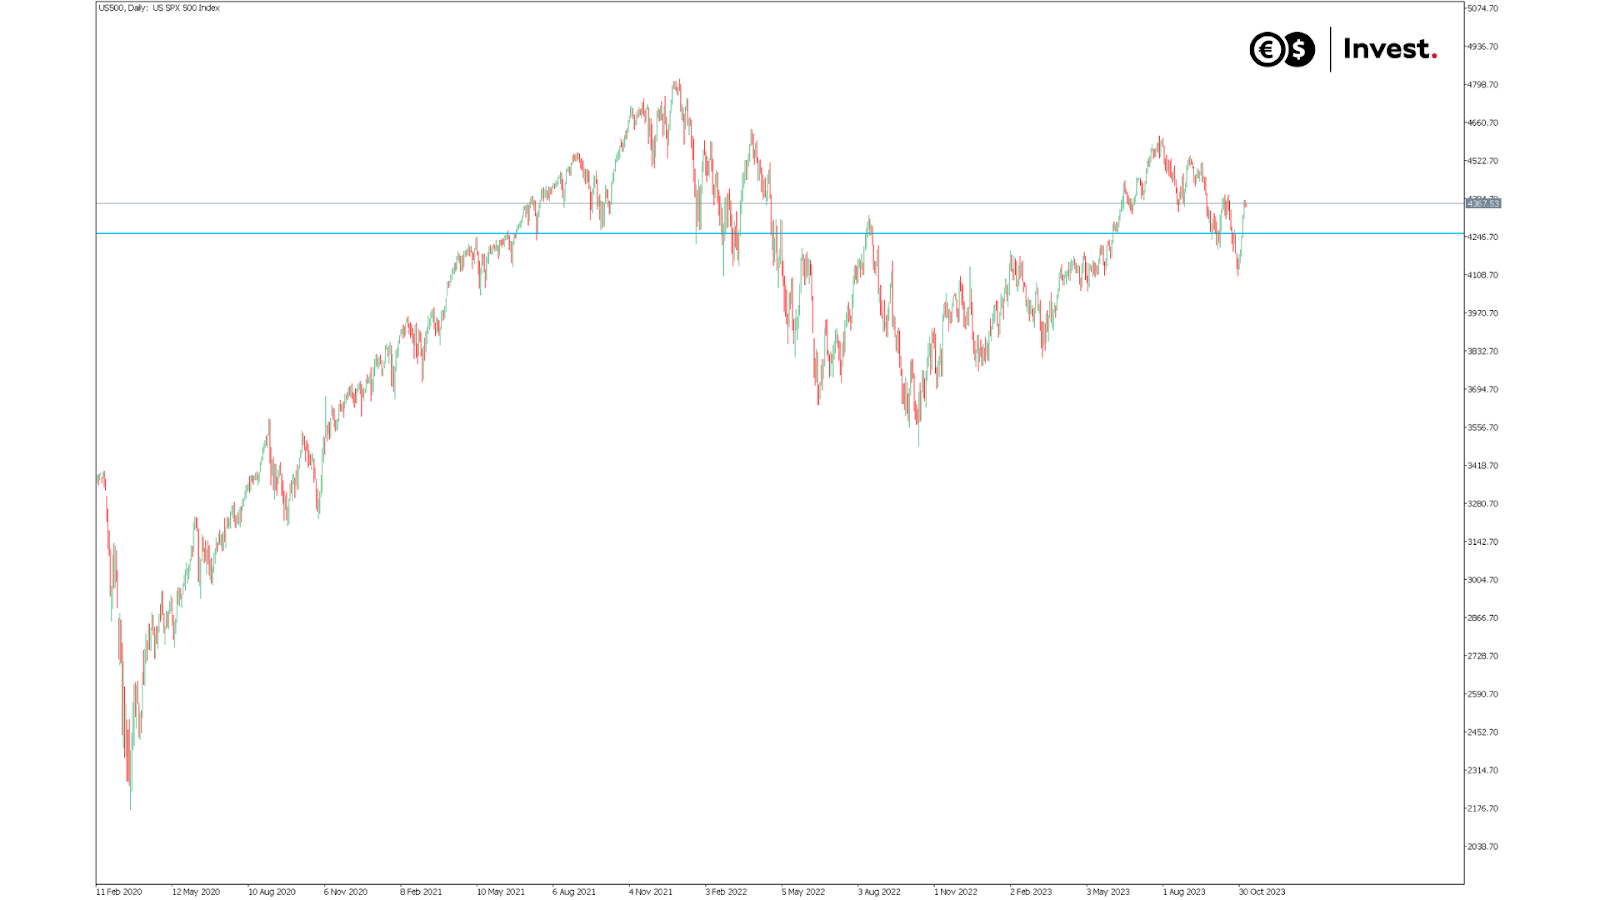
Source: Conotoxia MT5, US500, Daily
What is the value of the Nasdaq 100 index?
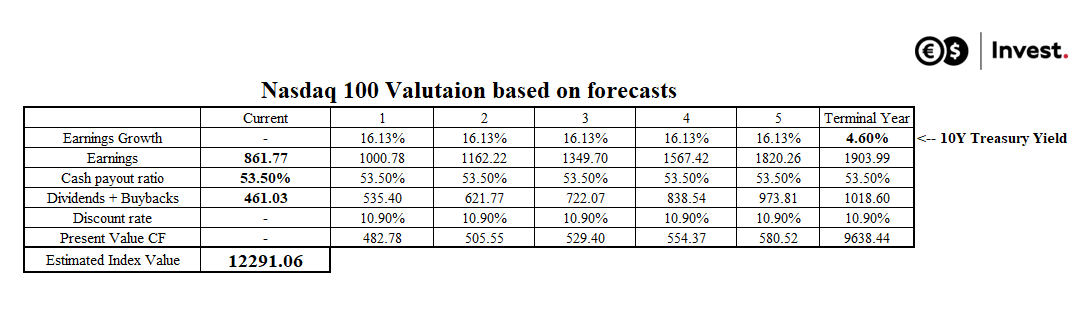
The Nasdaq 100 Index is largely technology-driven and has a higher level of earnings reinvestment, mainly due to its higher reinvestment earnings potential. The earnings payout rate to shareholders of this index is lower than that of the S&P 500 at 53.5%, with a dividend yield of 0.65% and a share repurchase programme yield of 2.76%. The total return to shareholders is therefore 3.41% (0.65% + 2.76%).
Since 2008, the index has grown at an average annual rate of 10.9%, which is taken as the discount rate. The projected weighted earnings growth rate by analysts for the next five years is 16.13%. As a result of these calculations, the value of the Nasdaq 100 index would be 12291.06, which could represent a correction of 19% from its current value. Thus, it appears that the Nasdaq 100 Index is showing signs of overvaluation and its upside potential could be significantly limited in the coming years.
Log in and take the opportunity!
Source: Conotoxia (own analysis)
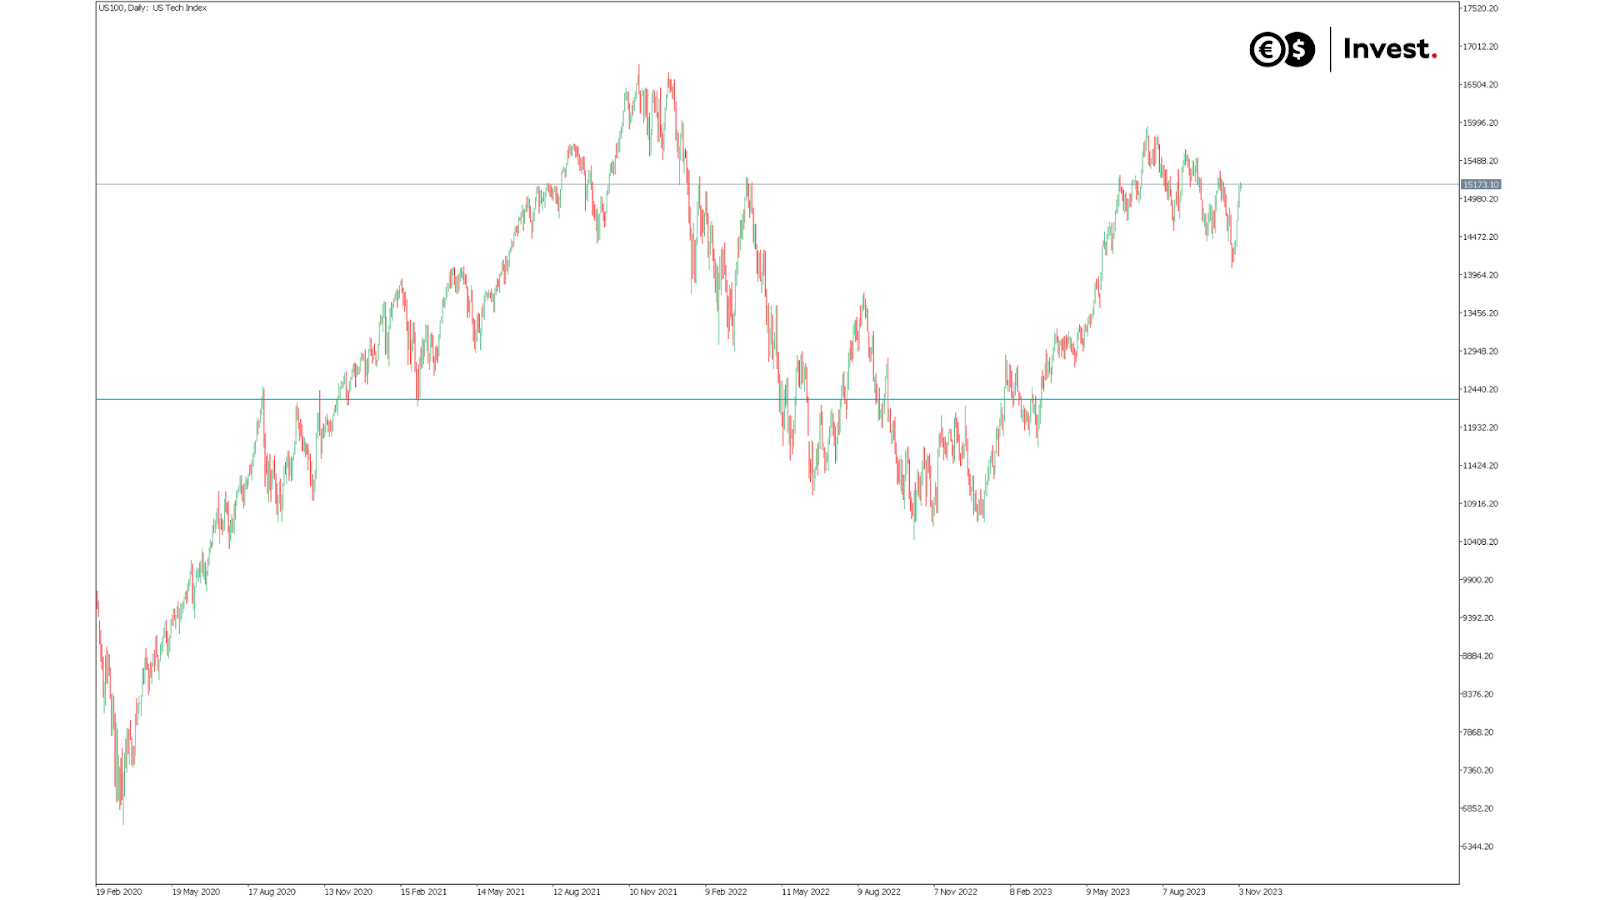
Source: Conotoxia MT5, US100, Daily
Grzegorz Dróżdż, CAI MPW, Market Analyst of Conotoxia Ltd. (Conotoxia investment service)
Materials, analysis and opinions contained, referenced or provided herein are intended solely for informational and educational purposes. Personal opinion of the author does not represent and should not be constructed as a statement or an investment advice made by Conotoxia Ltd. All indiscriminate reliance on illustrative or informational materials may lead to losses. Past performance is not a reliable indicator of future results.
CFDs are complex instruments and come with a high risk of losing money rapidly due to leverage. 72.95% of retail investor accounts lose money when trading CFDs with this provider. You should consider whether you understand how CFDs work and whether you can afford to take the high risk of losing your money.
Trade this news from Conotoxia Ltd. platforms
Go to your account