We have been observing the NZD/USD pair for a long time, mainly due to what we see on the chart. Well, from the point of view of technical analysis, the NZD/USD pair could have completed the simple correction labeled as ABC four weeks ago.
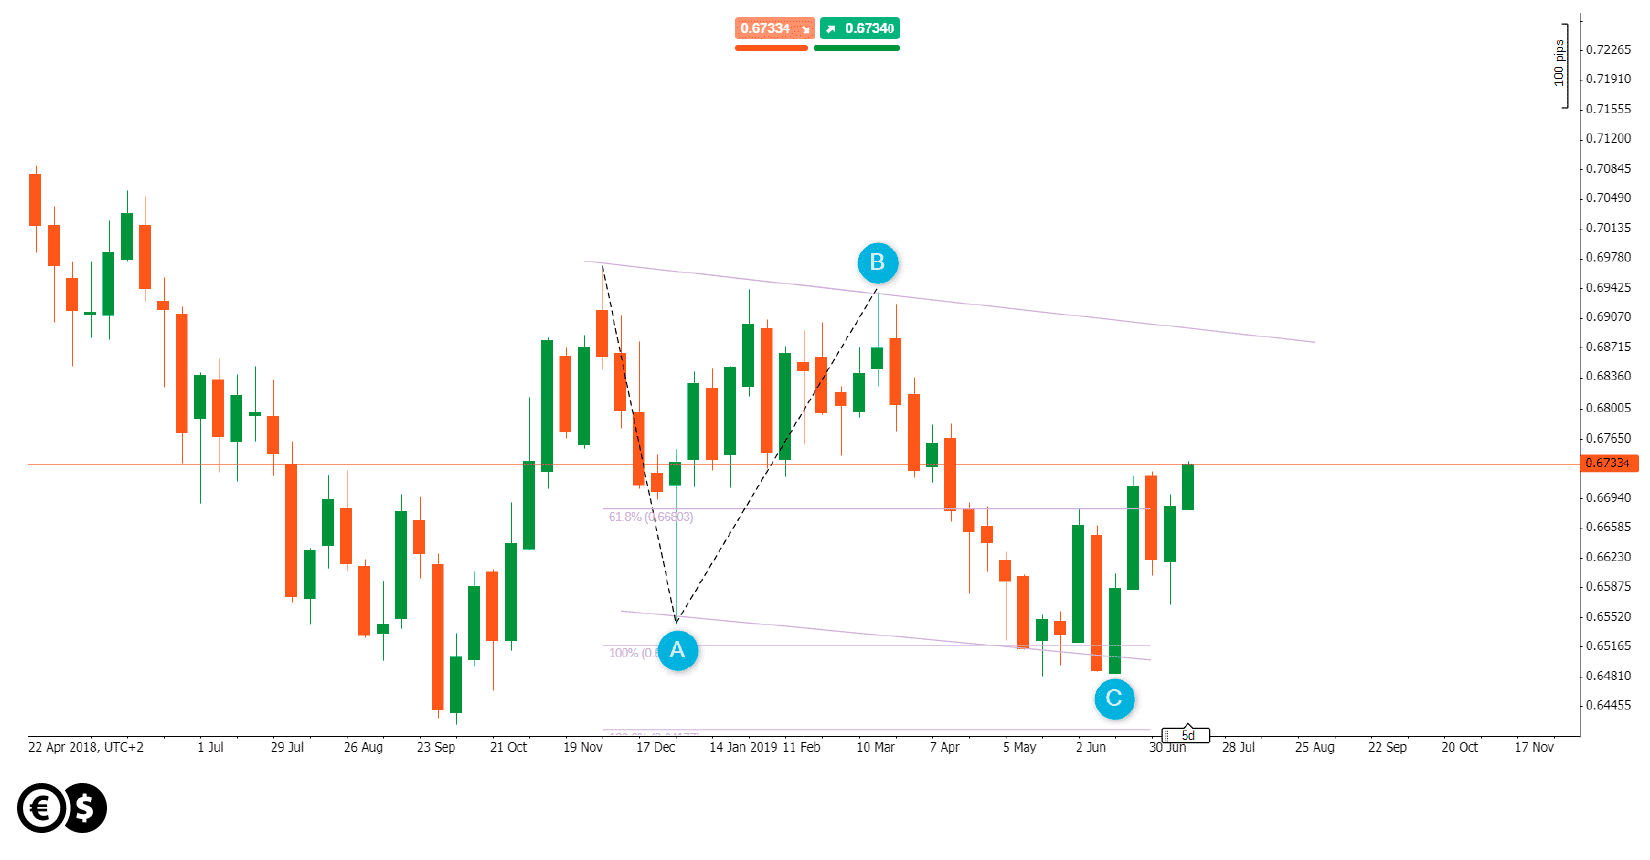
NZD/USD weekly chart with marked simple correction as ABC.
A simple correction is a pattern, where after a previous trend, a correction appears, which takes the shape of three sections marked as ABC. B cannot overcome the top of the previous trend, and C must overcome the A low, but cannot overcome the low of the beginning of the previous trend. What's more, it is assumed that when wave C and wave A are equal (100 percent), which is the strongest pattern.
Hence the presumption that the correction may have already ended and as a consequence, the NZD/USD pair may go to the nearest resistance, which seems to be at the line drawn through the last highs. Of course, not only technical factors can affect NZD, but also fundamental.
A week-old dovish speech by the chairman of the Federal Reserve of the United States indicates the possibility of cutting interest rates this month. In turn, in New Zealand such a scenario could be postponed thanks to further data, this time regarding inflation. Consumer prices in New Zealand increased at a faster rate in the second quarter, which was influenced by a sharp rise in fuel prices, while there were few signs of growing inflationary pressure in other parts of the economy. However, it was enough for the market to reduce its fears that the central bank will have to make a series of interest rate cuts. Inflation increased in the second quarter to 1.7 percent y/y from 1.5 percent.
The divergence in the expectations of central bank policy may be one of the main arguments for NZD/USD, which was also supported by the pattern on the chart. We will, therefore, continue to look at the development of the situation in this market.
Daniel Kostecki, Chief Analyst Conotoxia Ltd.
Materials, analysis and opinions contained, referenced or provided herein are intended solely for informational and educational purposes. Personal Opinion of the author does not represent and should not be constructed as a statement or an investment advice made by Conotoxia Ltd. All indiscriminate reliance on illustrative or informational materials may lead to losses. Past performance is not a reliable indicator of future results.
69% of retail investor accounts lose money when trading CFDs with this provider. You should consider whether you understand how CFDs work and whether you can afford to take the high risk of losing your money.
Trade this news from Conotoxia Ltd. platforms
Go to your account