"Metals like nothing more than chaos" – this expression may best describe the recent geopolitical and macroeconomic events in the world and how commodities' prices have appreciated in response to them.
Summary
- Gold is being purchased by central banks worldwide and other market players despite its price approaching it’s all-time-high level.
- Dow to Gold Ratio above 20 has historically indicated an overvalued stock market in relation to gold, which may potentially lead to such market crashes as the Great Depression, Nixon Shock, and Dot-com Bubble burst.
- The world may be entering a new bullish commodities supercycle fueled by the global recovery from the Covid-19 pandemic, the actualisation of the defense industry amid geopolitical tensions around the world, and heavy investments in green infrastructure.
- In recent months, gold has been favored by central banks around the world along with other market participants, considerably increasing gold reserves to hedge against inflation, store wealth amid geopolitical uncertainties, and potentially get ready for a new bullish commodities supercycle.
Gold has historically served as a store of wealth amid periods of high inflation and a defensive asset during economic turmoil. Gold doesn't like high interest rates – mainly because investors prefer income-producing assets during periods of high interest rates. Furthermore, high interest rates in the US boost the US dollar, which puts pressure on gold priced in this currency. Meanwhile, gold priced in other currencies looks overvalued, placing pressure on its demand.
Despite higher-than-wished-for interest rates, gold has been able to maintain not far from it’s all-time high price, indicating that investors might be ready to sacrifice other income producing-assets in exchange for the safety provided by gold and other precious metals.
Dow to Gold ratio
A handy ratio to keep an eye on is the Dow to Gold ratio. This ratio tells us how many ounces of gold you need to purchase one share of the Dow Jones Industrial Average (Dow) index. Gold investors value this ratio highly, and certain investment strategies have even been developed around it.
- Low Dow to Gold ratio indicates that either gold is trading at high prices or Dow is trading at low prices (or a combination of both), meaning it may be beneficial to sell gold or buy stocks (or both).
- High Dow to Gold ratio indicates that either gold is trading at low prices or Dow is trading at high prices (or a combination of both), meaning that it may be beneficial to either buy gold or sell stocks (or both).
Historically, the ratio has ranged from 1.31 at the one-day gold price peak in January 1980 to 42 at the height of the dot.com bubble. While there is no one specific rule on how to read the ratio, history shows us that once the ratio reaches the level of 15 or higher, a strong correction in stock prices may be expected in the future. Meanwhile, a very low ratio (below 5) indicates that the stock market may be undervalued to gold.

Source: longtermtrends.net Dow Jones / Gold ratio (log) (January 1, 1924 – January 9, 2023)
Interestingly, gold has been traded close to its historic highs since August 2020. Still, the Dow to Gold ratio does not reflect this situation (previously, when Dow to Gold ratio was around 20, the gold price was around 600 US dollars per ounce), indicating that the Dow index has maintained proportionally high prices during this period.
It is crucial to remember that the Dow to Gold ratio has relatively long cycles. For example, the upward trend from the low of 1.59 in 1933 to the high of 27.78 in 1966 lasted for 33 years, and it took 5 more years before the Dow to Gold ratio crashed in 1971 during the "Nixon Shock". The current upward trend started in 2011, and a high of 28.86 was reached in 2018. As we are now five years from the previous high, the ratio may signal an upcoming plunge, or it may very well keep its current course for a couple more years.
Commodities supercycles
The Dow to Gold ratio's long cycles may be explained as an aftermath of commodities supercycles. Supercycles in commodity prices have earned their name by lasting longer than economic cycles and may persist for over a decade. Furthermore, the name supercycle is used based on the vast breadth of commodities it covers – supercycles have been compared with black holes – no individual commodity is able to escape the gravity of a supercycle.
The Bank of Canada has identified four commodities supercycles since the 1900s. Generally, the common driver for such supercycles is a significant, unexpected increase in demand combined with slow-moving supply growth. Meanwhile, the driving force for each increase in demand can be identified separately. The first supercycle was linked with industrialisation in the US in the early 1900s, and the second was the boost in the defense industry leading to the Second World War. The third supercycle was linked with the reindustrialisation of Europe in the post-war period. The fourth supercycle was connected with the boom in demand from emerging markets, including China. It peaked in 2012, after which equities took back the focus over the last decade.
Many analysts argue that a number of factors, such as the global recovery from the Covid-19 pandemic, the revitalisation of the defense industry amid war in Europe and other geopolitical tensions around the world, and heavy investment in green infrastructure such as solar panels and wind turbines, as well as significant growth in demand for electric vehicles, are strong enough to fuel a new commodity supercycle. Moreover, the surge in the prices of various commodities since 2021 (including gold, which seems to be very determined to reach its all-time high sooner rather than later) seems to be in line with the analysts' views.
-- For an expanded view of the future of lithium, press this link.
Central banks are already on the train of gold
Central banks of numerous countries worldwide are accumulating gold reserves on their balance sheets. In 2022, central banks accumulated gold reserves at a pace last seen in 1967, with the demand for gold up 28% year-on-year in the third quarter. The key purchasers of gold at the time were Turkey, Uzbekistan, and Kazakhstan. In November, however, we can see that Turkey not only continued accumulating gold at a faster pace than before, but China also purchased more gold than all mentioned countries in the previous month.
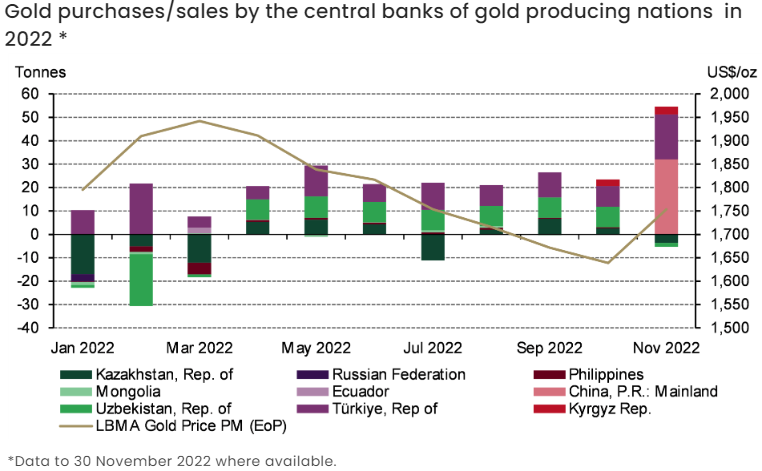
Source: gold.org
While the most cited reason for stockpiling gold reserves generally is its ability to hedge against inflation, it should be noteworthy to acknowledge other reasons as well:
- Central banks may be purchasing gold as an alternative to the US dollar in their foreign exchange reserves;
- Central banks may be looking for a safer store of wealth amid geopolitical uncertainties and volatile markets;
- Central banks may recognise the beginning of a new commodities supercycle and expect gold to appreciate in value among other commodities.
It is possible that all of these factors, as well as more individual ones, are behind central bank gold accumulation. Continued gathering of gold could push its price further above current all-time highs and potentially have a bearish effect on the US dollar as a main reserve currency.
Commodities supercycles and the Dow to Gold ratio (as rather connected) move in long swings, and any potential upcoming move may take a long time to realize. Nevertheless, it is beneficial to be aware of the above-described processes to be able to react swiftly and make confident investment decisions.
Santa Zvaigzne-Sproge, CFA, Head of Investment Advice Department at Conotoxia Ltd. (Conotoxia investment service)
Materials, analysis and opinions contained, referenced or provided herein are intended solely for informational and educational purposes. Personal opinion of the author does not represent and should not be constructed as a statement, or an investment advice made by Conotoxia Ltd. All indiscriminate reliance on illustrative or informational materials may lead to losses. Past performance is not a reliable indicator of future results.
CFDs are complex instruments and come with a high risk of losing money rapidly due to leverage. 76.41% of retail investor accounts lose money when trading CFDs with this provider. You should consider whether you understand how CFDs work and whether you can afford to take the high risk of losing your money.