It seems that the popular US index S&P 500, created on the basis of half a thousand of the largest American companies listed on the stock market, have a problem with the continuation of the bull market. Despite the fact that a new record for all time was set this week, the market returned quite quickly.
The decline that we observed in the last quarter of last year with the rebound lasting from the end of December, it is the strongest on the US stock market in history. Never before such a dynamic decline, the market has risen in the same dynamic fashion as in recent months. It naturally gave hope that the new highs of the bull market that started after the financial crisis a decade ago can be established. That's what happened. The first index that set the records of all time was NASDAQ 100, followed by the S&P 500.
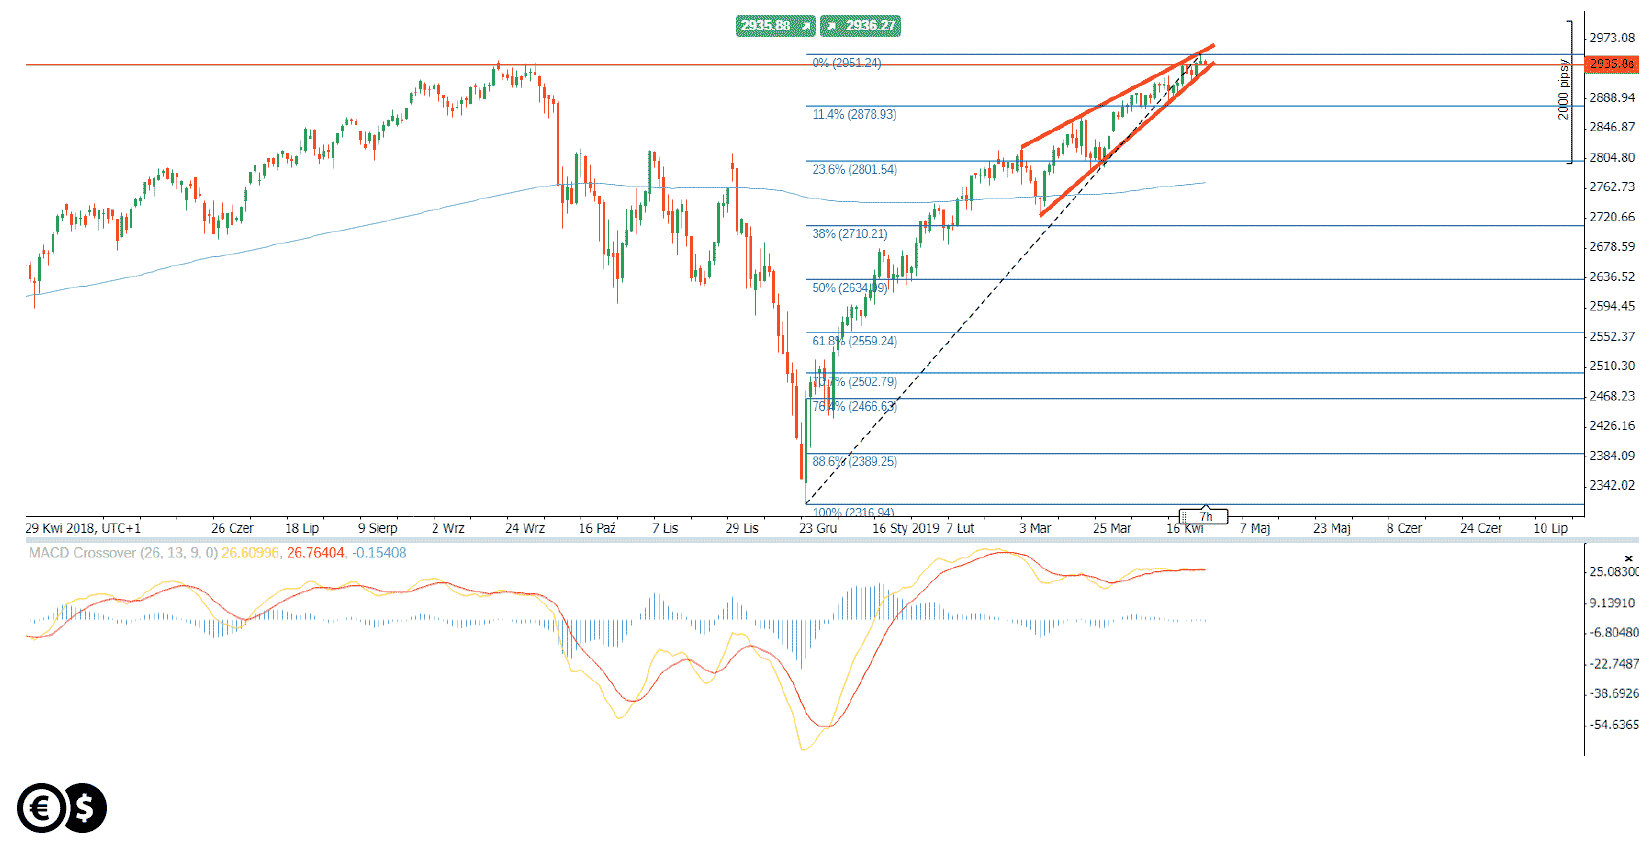
Chart: S&P 500, D1. Conotoxia trading platform.
From the perspective of the chart, in the short-term, the market created the shooting star candlestick pattern yesterday and consequently defended the previous high. Therefore, the current situation resembles the double top pattern, but only in the first phase of its creation. Additionally, in the chart we can observe the potential rising wedge pattern. During its creation, the market reduces the amplitude of fluctuations and as a consequence, demand may have less and less power to create new higher highs.
Confirmation of demand capitulation is usually the breakout of the lower limit in the wedge pattern. At that time, the market may move to the nearest support levels set by the Fibonacci retracements at 23.6 (2801) and 38.2% (2710 points).
Daniel Kostecki, Chief Analyst Conotoxia Ltd.
Materials, analysis and opinions contained, referenced or provided herein are intended solely for informational and educational purposes. Personal Opinion of the author does not represent and should not be constructed as a statement or an investment advice made by Conotoxia Ltd. All indiscriminate reliance on illustrative or informational materials may lead to losses. Past performance is not a reliable indicator of future results.
59% of retail investor accounts lose money when trading CFDs with this provider. You should consider whether you understand how CFDs work and whether you can afford to take the high risk of losing your money.
Trade this news from Conotoxia Ltd. platforms
Go to your account